

CoreLogic reported that their single-family rent index (SFRI) for March rose 3.4 percent from its year-earlier level. This matches last month’s reported year-over-year rent growth but is down from the 4.3 percent annual rent growth rate reported in March 2023.
Real vs. nominal
The history of the overall SFRI growth rate since January 2020 is shown in the first chart, below. The chart shows both the nominal year-over-year rent growth rate and also the real rate. The real rate is the year-over-year nominal rate less the year-over-year rate of inflation as measured by the not-seasonally-adjusted CPI-U.
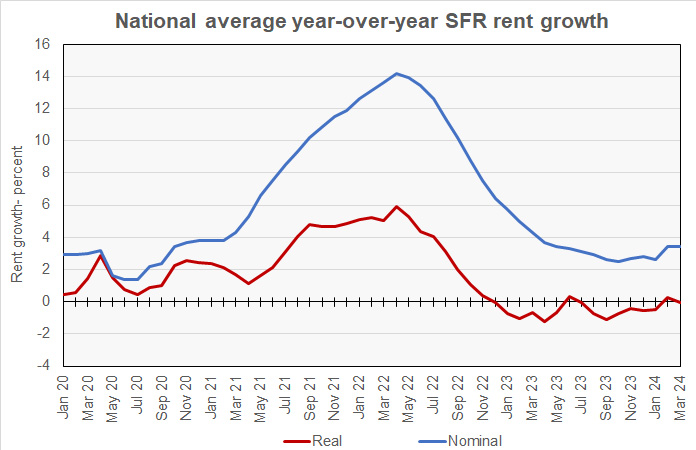
The chart shows that, while the nominal rate of year-over-year rent growth has dropped to pre-pandemic levels, the recent inflation rate has resulted in the real rent growth rate being negative for 14 of the last 16 months.
For reference, Yardi Matrix found that single-family rent growth in March was 1.2 percent year-over-year as rents fell for the month. However, Yardi Matrix focuses on properties of 50 or more units while CoreLogic takes a broader look at the single-family rental market since small holdings still represent a majority of the market.
Low priced properties lag behind
In addition to the overall SFRI, CoreLogic calculates SFR rent growth by the relative asking rent for the properties it covers. It divides the properties into 4 groups: those priced at 75 percent or less than the regional median (Low), those priced at 75 to 100 percent of regional median (Low-mid), those priced at 100 to 125 percent of regional median (High-mid) and those priced above 125 percent of regional median (High). The results for the six months to March 2023 are shown in the next chart, below.
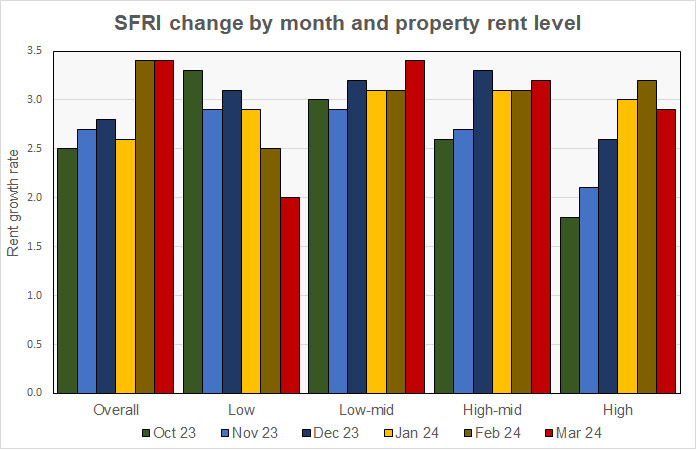
Each block of bars represents either the overall results or the results for one of the pricing tiers. Each bar color relates to a monthly report. The chart shows that the overall rate of rent growth has been elevated for the last two months. It also shows that the rate of rent growth has recently been falling for the lowest price tier and rising for the highest price tier.
Since May 2022, it has been the case that the rent growth rate for the lowest priced- tier of properties has exceeded the overall rent growth rate. However, that trend has been broken for the last two months. In March, the rent growth rate for the lowest priced tier of properties was only 59 percent of the overall rate. This compares to an average since 2021 of 110 percent.
Ranking the metros
CoreLogic reports the year-over-year rate of growth in the SFRI for a select group of metropolitan areas. Seattle occupies the top position for highest rent growth rate this month. It recorded SFR rent growth of 6.3 percent, down from 6.8 percent last month. New York City fell to second place with growth of 5.3 percent. Boston (5.2 percent) remained in third place while Detroit (5.0 percent) and Honolulu (4.5 percent) rounded out the top 5 metros.
Three metros saw SFR rents decline in March. The metros are Austin (-3.5 percent), Miami (-3.2 percent) and New Orleans (-1.4 percent). Orlando (0.5 percent) and Minneapolis (0.9 percent) filled out the five metros with the lowest rent growth rates.
CoreLogic is a data and analytics company. It calculates the SFRI using “a repeat pairing methodology to single-family rental listing data in the Multiple Listing Service.” The CoreLogic report is available here.


