

The producer price index (PPI) report from the Bureau of Labor Statistics (BLS) stated that construction material prices were unchanged month-over-month in May on a seasonally adjusted basis. However, the change in construction material prices for April was revised to a 0.3 percent increase from the 0.1 percent increase reported last month. The index of components and materials for construction was up 2.0 percent from its year-earlier level.
Overall prices for processed goods for intermediate demand were down 1.5 percent for the month. The volatile prices of processed fuels and lubricants fell 8.0 percent. The overall processed goods for intermediate demand index was 0.7 percent lower than its year-earlier level.
For reference, the changes in these indices compare with a 3.3 percent rise in the all-items consumer price index (CPI-U) for the 12 months ending in May. The seasonally adjusted May CPI-U was unchanged from April’s level. Energy prices were down 2.0 percent for the month but up 3.7 percent year-over-year. The shelter portion of the CPI-U was up 0.4 percent for the month and was 5.4 percent higher than its year-ago level. Seasonally adjusted rent of primary residence was up 0.4 percent for the month and 5.3 percent year-over-year.
Yield Pro compiled the BLS reported changes for our standard list of construction materials prices. These are prices of materials which directly impact the cost of constructing an apartment building. The first two right hand columns of the table provide the percent change in the price of the commodity from a year earlier (12 Mo PC Change) and the percent change in price from April (1 Mo PC Change). If no price data is available for a given commodity, the change is listed as N/A.
The pre-COVID column lists the change in the current construction materials prices relative to the average of prices from December 2019 through February 2020, before the pandemic impacted the economy. This provides a longer-term view of construction materials price trends.
| Commodity | 12 Mo PC Change | 1 Mo PC Change | Pre-covid Change |
| Softwood lumber | (8.1) | (3.6) | 11.5 |
| Hardwood lumber | 1.8 | 0.9 | 30.1 |
| General millworks | 1.2 | (0.1) | 31.2 |
| Soft plywood products | 0.9 | (1.0) | 71.5 |
| Hot rolled steel bars, plates and structural shapes | (8.1) | (1.6) | 50.3 |
| Copper wire and cable | 18.0 | 9.6 | 52.3 |
| Power wire and cable | 16.7 | 4.5 | 133.5 |
| Builder’s hardware | (0.9) | 0.0 | 24.4 |
| Plumbing fixtures and fittings | 1.6 | 0.3 | 19.6 |
| Enameled iron and metal sanitary ware | N/A | N/A | N/A |
| Furnaces and heaters | 1.2 | (2.0) | 35.5 |
| Sheet metal products | 2.1 | (0.1) | 48.0 |
| Electrical Lighting fixtures | (0.1) | 0.3 | 18.0 |
| Nails | (13.5) | (1.7) | 20.8 |
| Major appliances | (0.3) | (0.6) | 21.5 |
| Flat glass | (1.1) | 0.5 | 31.9 |
| Ready mix concrete | 5.6 | (0.4) | 36.0 |
| Asphalt roofing and siding | 4.5 | 2.7 | 42.4 |
| Gypsum products | 2.2 | 0.4 | 45.7 |
| Mineral wool insulation | 2.4 | 0.9 | 45.8 |
| CPI-U (unadjusted) | 3.3 | 0.2 | 21.6 |
The prices used by the BLS in compiling the indexes are collected on the Tuesday of the week containing the 13th day of the month. In May that would have been May 14. In the June report, the data collection date will be June 11.
The first chart, below, shows the price index history for wood products over the past 37 months.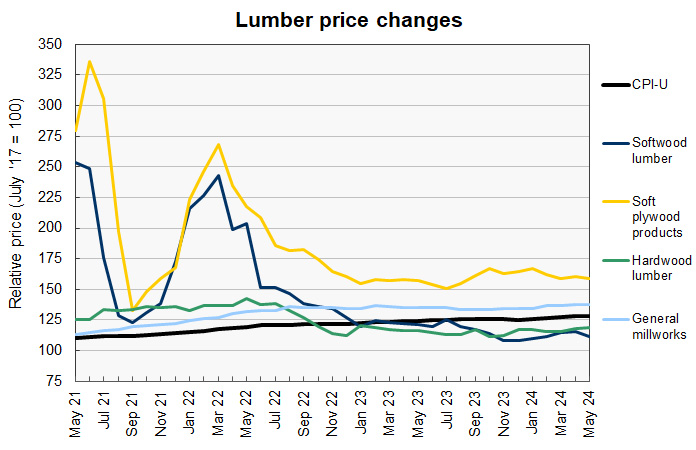
The softwood lumber price index was reported to fall by 3.6 percent in May. In addition, the price index for April was revised lower by 0.5 percentage points so pricing was even softer than the headline number would indicate. Softwood lumber prices are now down 8.1 percent year-over-year.
The hardwood lumber price index was reported to rise 0.9 percent in May. However, the price index for April was revised lower by 0.1 percent so the reported soft plywood price index is 0.8 percent higher than the preliminary level reported last month.
The soft plywood price index was reported to fall 1.0 percent in May. However, the price index for April was revised higher by 0.6 percent so the reported soft plywood price index is 0.4 percent lower than the preliminary level reported last month.
The next chart, below, shows the recent history of several other construction materials prices. These are relatively simple commodities whose prices are strongly driven by those of the materials of which they are comprised.
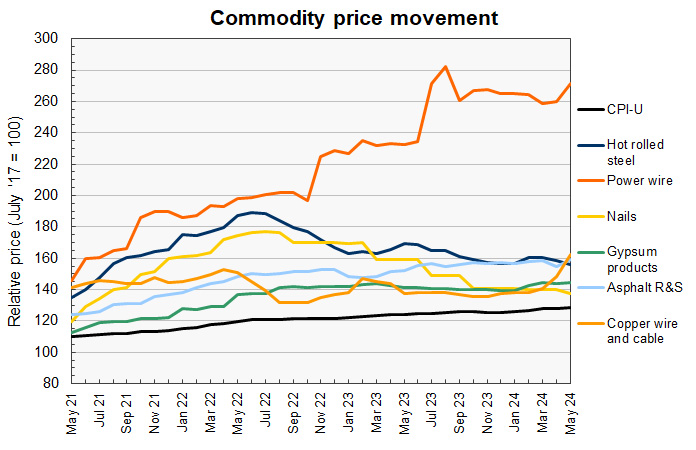
The price index for copper wire and cable took another big jump this month, rising 9.6 percent on top of last month’s 5.1 percent reported gain. Copper wire prices are now up 18.0 percent year-over-year. Reports are that the rise in copper wire prices is being driven by investors speculating that rising demand from the transition to green energy and to electric vehicles along with demand from the construction of data centers to support AI will keep prices high.
The price index for power wire and cable was reported to rise 4.5 percent in May. It is now 16.7 percent higher than its year-earlier price, reflecting the rise in the price of aluminum.
The price index for hot rolled steel bars was reported to fall by 1.6 percent.
Price changes for several of the more finished goods from our sample are illustrated in the final chart, below. There are some unusual trends in this data.
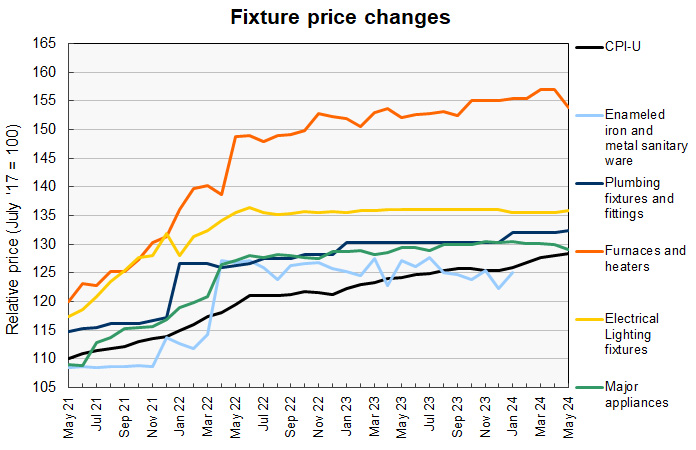
For the fourth consecutive month, no price index was reported for enameled iron and metal sanitary ware. However, price indexes were reported for flat glass for April and May, filling in the missing data.
A new price level was reported for plumbing fixtures and fittings, breaking a streak of 4 months where the exact same price index was reported.
The price index for furnaces and heaters was reported to be down 2.0 percent from that of April. In addition, the April index was revised lower by 0.4 percent in this month’s report.
The price index for electrical lighting fixtures continued to exhibit only small changes this month.
The full current BLS report can be found here.


