

The latest commercial property price report from MSCI Real Capital Analytics said that multifamily property prices fell 1.0 percent in May from their level of the month before. This is more than last month’s reported decline of 0.3 percent, and also exceeds March’s reported decline of 0.9 percent. Prices were down 8.9 percent from their level of one year ago.
Defining CPPI
MSCI tracks an index called the Commercial Property Price Index (CPPI). The index is computed based on the resale prices of properties whose earlier sales prices and sales dates are known. The index represents the relative change in the price of property over time rather than its absolute price. Note that, as new properties are added to the MSCI dataset each month, they recalculate the CPPI all the way back to the beginning of the data series.
Apartment price growth revised lower
The first chart, below, shows how the CPPI’s for all commercial property as a single asset class and for apartments have changed since January 2016. To simplify the comparison, both CPPI’s have been normalized to values of 100 in January 2012. The chart also contains trend lines showing the straight-line average rates of price appreciation for the two asset classes based on their performances from January 2012 to December 2019.
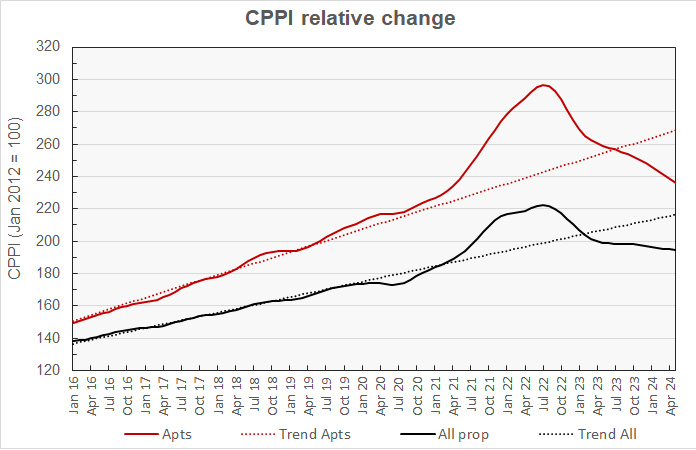
The chart shows that multifamily property prices are continuing to fall, seemingly at an accelerating rate. Multifamily property prices have now fallen 20.4 percent from their peak but are still 11.2 percent above their level in January 2020. They are now 12.1 percent below their pre-pandemic trend.
Prices for all commercial property as a single asset class are down 12.5 percent from their peak but are 12.0 percent above their level in January 2020. They are 10.1 percent below their pre-pandemic trend.
The next chart plots the month-over-month changes in the values of the CPPI since January 2021 for all commercial property as a single asset class and for apartments. It also includes the same metrics based on the data included in last month’s report.
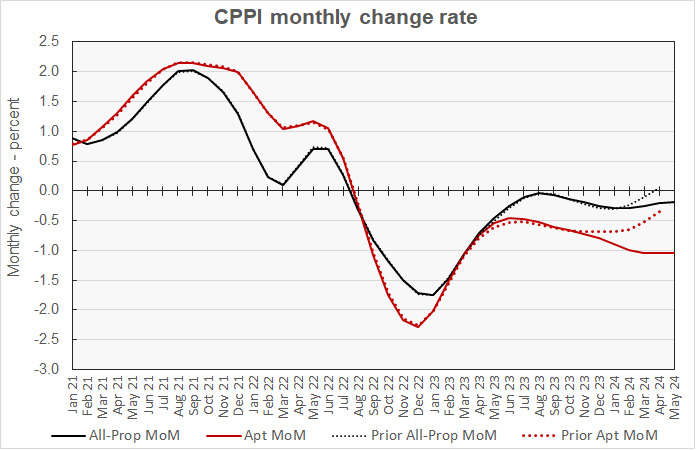
The chart shows that last month’s data indicated that multifamily property prices were approaching breakeven. However, this month’s data indicate that values have been falling steadily at around 1 percent per month for the last 4 months with no sign of this decline ending.
The outlook for all commercial property pricing also looks gloomier with this month’s revisions. While last month’s report indicated that commercial property prices had eked out an increase for that month, this month’s revisions show them still falling, if only at 0.2 percent per month.
Industrial continues to lead
Industrial property was the only type to see prices rise in May, managing a 0.9 percent rise for the month. Retail had the next best monthly performance, with prices falling 0.2 percent. Prices for suburban office properties fell 0.4 percent for the month while offices within central business districts (CBD) continued to experience the worst performance, with prices declining 1.4 percent for the month.
Industrial property was also the best performing on a year-over-year basis, with prices rising 8.7 percent. Prices for offices within CBDs were down 30.8 percent while prices for suburban offices fell 10.9 percent. Prices for retail property were down 1.8 percent.
Major metro commercial property prices lag
The MSCI report provides data comparing the price changes of commercial property in 6 major metro* areas against those in the rest of the country, although it does not separate out apartments from other commercial property types in this comparison. The next chart, below, plots the history of the relative price indexes since January 2016 for both market segments, along with trend lines based on straight-line fits to the changes in these indexes between January 2012 and December 2019. For purposes of this chart, both price indexes were set to a value of 100 for January 2012.
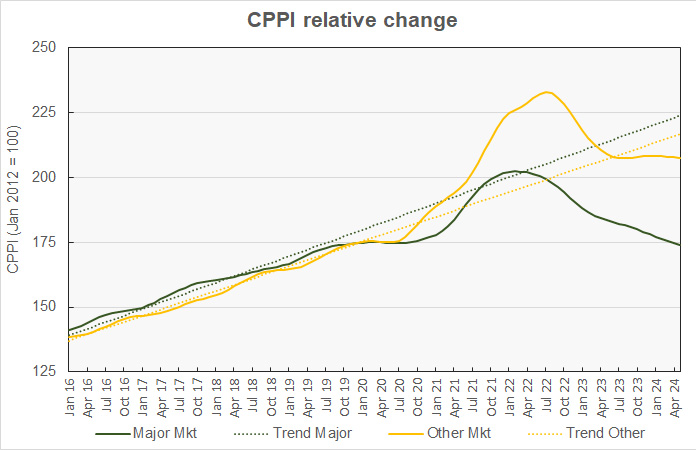
The chart shows that the CPPI for major metro commercial property has fallen 14.0 percent from its peak and is now 0.5 percent below its level in January 2020. It is 22.3 percent below its long-term trend. By contrast, the change in CPPI for property in other markets has been hovering around zero for the last 8 months, but more about that later. The other markets CPPI has now fallen 10.9 percent from its peak but is 18.5 percent above its level in January 2020. The non-major metro CPPI is 4.2 percent below trend.
The final chart plots the history of the month-over-month changes in the price indexes for the two property markets since January 2021 along with last month’s monthly price change data.
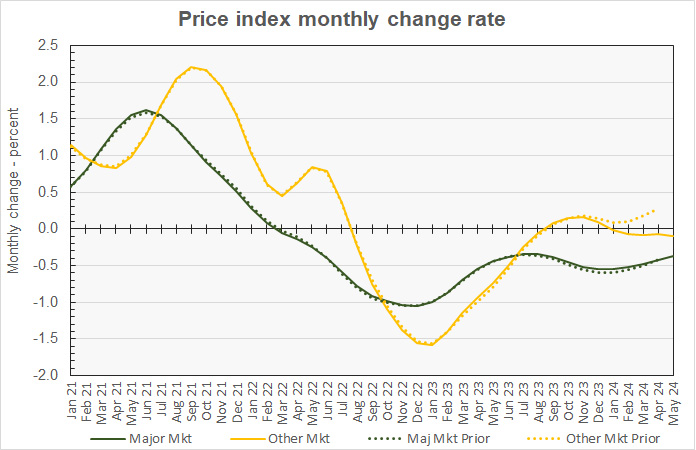
The chart shows that month-over-month price appreciation for major markets seems to exhibit some seasonality with its best performance in the May to July time frame. This month’s revisions to the data did not significantly change the picture for major market performance. However, this month’s revisions changed the results for non-major markets for the last 4 months from small, but growing price gains to small, but increasing price drops.
By the numbers, price appreciation for commercial property in major metros was reported to be -0.4 percent for the month and -5.2 percent for the year. Prices for commercial property in non-major markets were reported to be down 0.1 percent for the month and down 0.7 percent year-over-year.
The full report provides more detail on other commercial property types. Access to the MSCI report can be obtained here.
*The major metros are Boston, Chicago, Los Angeles, New York, San Francisco and Washington DC.


