

CoreLogic reported that their single-family rent index (SFRI) for April rose 3.0 percent from its year-earlier level. This is down 0.4 percentage points from last month’s reported year-over-year rent growth rate and is down from the 3.7 percent annual rent growth rate reported in April 2023.
Adjusted vs. nominal
The history of the overall single-family rent growth rate since January 2020 is shown in the first chart, below. The chart shows both the nominal year-over-year rent growth rate and also the wage-adjusted rate. The wage-adjusted rate is the year-over-year nominal rate less the year-over-year rate of wage growth as measured by the seasonally-adjusted average hourly earnings of production and non-supervisory employees.
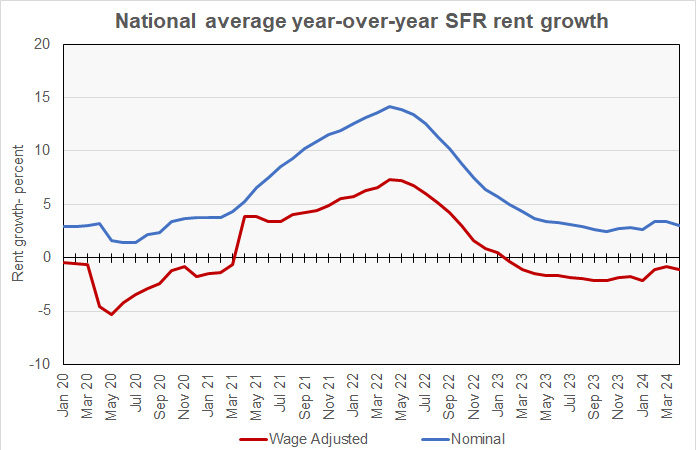
Note that, during the pandemic-related shutdowns of 2020, many lower income workers were forced to stay home where they could not work, while higher income workers could often work from home and so remained employed. This caused an artificial spike in average hourly wages. This accounts for much of the drop in wage-adjusted rent growth in 2021.
The chart shows that wage-adjusted single-family rent growth has been negative since February 2023. However, this relative decline has not come close to making up for the increase in rents that took place in 2021 and 2022.
For reference, Yardi Matrix found that single-family year-over-year rent growth in April was 1.3 percent as rents fell $9 for the month. However, Yardi Matrix focuses on properties of 50 or more units while CoreLogic takes a broader look at the single-family rental market, since small holdings still represent a majority of the inventory.
Low priced properties break the trend
In addition to the overall SFRI, CoreLogic calculates single-family rent growth by the relative asking rent for the properties it covers. It divides the properties into 4 groups: those priced at 75 percent or less than the regional median rent (Low), those priced at 75 to 100 percent of regional median (Low-mid), those priced at 100 to 125 percent of regional median (High-mid) and those priced above 125 percent of regional median rent (High). The results for the six months to April 2023 are shown in the next chart, below. Each block of bars represents either the overall results or the results for one of the pricing tiers. Each bar color relates to a monthly report.
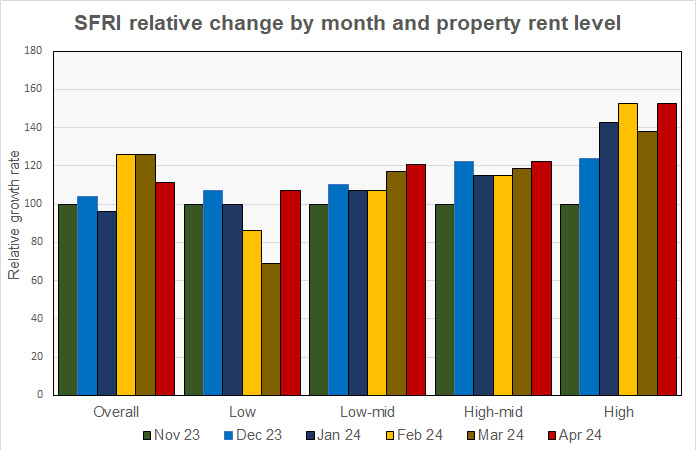
The chart shows that the overall rate of year-over-year rent growth returned closer to the recent average after being elevated for the last two months. It also shows that, while the rate of rent growth has recently been falling for the lowest price tier, it jumped this month. The rent growth rate for the other price tiers have generally been rising over the last 5 months and that trend continued in April.
Ranking the metros
CoreLogic reports the year-over-year rate of growth in the SFRI for a select group of metropolitan areas. St. Louis, which was not in the top 5 metros for rent growth last month, jumped into the top spot in April. It recorded SFR rent growth of 6.3 percent, matching last month’s leader, Seattle. New York City remained in second place with rent growth of 5.6 percent. Boston (5.4 percent) remained in third place while Seattle (5.2 percent) and San Francisco (4.9 percent) rounded out the top 5 metros.
Two metros saw SFR rents decline in April. The metros are Miami (-1.8 percent) and Austin (-1.0 percent). Phoenix (0.1 percent), Orlando (0.2 percent) and New Orleans (1.1 percent) filled out the five metros with the lowest rent growth rates.
CoreLogic is a data and analytics company. It calculates the SFRI using “a repeat pairing methodology to single-family rental listing data in the Multiple Listing Service.” The CoreLogic report is available here.


