

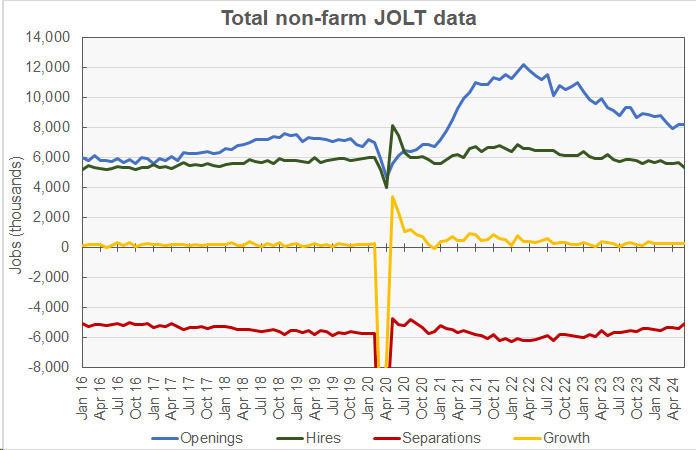
The Job Openings and Labor Turnover (JOLT) report from the Bureau of Labor Statistics (BLS) said that the number of job openings in June was 8.18 million. This was reported to be down 46,000 openings month-over-month. However, the openings figure for May was revised higher by 90,000 openings, so the June openings figure is 44,000 higher than the initial level reported for May last month. Job openings were down 941,000 openings from the year-ago level.
Hiring was reported to be down from last month’s revised (-101,000) figure for the economy as a whole, falling 314,000 to a level of 5.34 million hires. Total separations fell 302,000 from last month’s revised (-25,000) figure to a level of 5.10 million. Within total separations, quits were reported to fall 3.6 percent while layoffs fell 10.7 percent. Quits represented 64.4 percent of total separations for the month.
Overall employment grows despite reduced hiring
For a discussion of the JOLT report and how it relates to the Employment Situation Report, please see the paragraph at the end of this article.
The June job openings figure represents 4.9 percent of total employment plus job openings. For comparison, the unemployment rate in June was reported to be 4.1 percent and 6.81 million people were unemployed. Another 5.23 million people said that they would like a job but were not counted as being in the labor force since they were not actively seeking employment.
The excess of hiring over separations in the June JOLT report implies an employment increase of 246,000 jobs for the month. Last month’s employment increase was revised to 258,000 jobs, down by 76,000 jobs from the gain reported last month.
Of those leaving their jobs in June, 3.28 million quit voluntarily, while 1.50 million people were involuntarily separated from their jobs. The remainder of people leaving their jobs left for other reasons, such as retirements or transfers. The portion of people quitting their jobs was down 0.1 percentage point from last month’s figure at 2.1 percent of the labor force. The involuntary separations rate was down 0.1 percentage point from last month’s figure at 0.9 percent.
Total non-farm JOLT data since January 2016 is shown in the first chart, below.
Construction jobs grow on lower separations
The next chart, below, shows the employment situation for the construction jobs market over the last 49 months. It shows that June saw a net gain of 54,000 construction jobs compared to last month’s revised gain of 15,000 jobs.
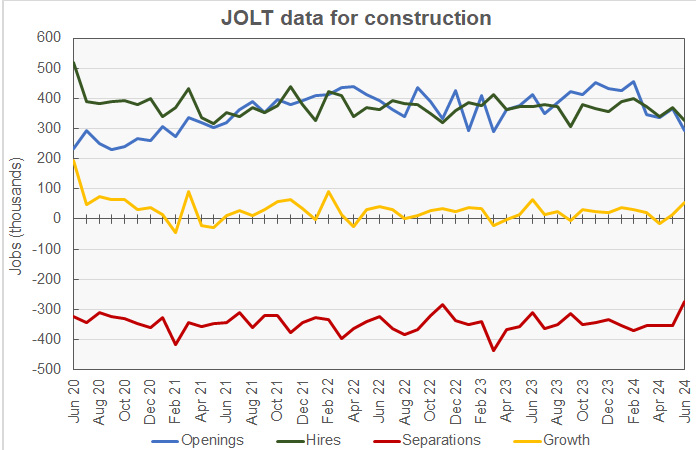
The preliminary job openings figure for June was reported to be down 71,000 openings from last month’s revised (+27,000) figure at 295,000 openings. Openings were reported to be down 28.7 percent from last year’s level and were reported to represent 3.5 percent of construction employment plus job openings.
Hiring was reported to be down by 41,000 jobs in June from the prior month’s revised (-14,000) jobs figure at 328,000 new hires. The number of construction jobs that were filled in June was reported to be down 12.3 percent year-over-year.
Construction jobs total separations were reported to fall by 80,000 jobs from the prior month’s revised (-6,000) figure to 274,000 jobs. That is the lowest figure for total separations since September 2014.
Quits were reported to fall by 64,000 jobs from May’s revised (-11,000) figure to a level of 124,000 jobs. Quits represented 45.3 percent of separations for the month, up by 6.1 percentage points from the revised level of last month.
Layoffs were reported to fall by 17,000 from May’s revised (+3,000) figure to 133,000 jobs. “Other separations” which includes retirements and transfers, were reported to be up 2,000 at 17,000 jobs.
RERL job openings continue to fall
The last chart, below, shows the employment situation for the real estate and rental and leasing (RERL) jobs category. Employment in this jobs category was reported to be up 11,000 jobs for the month.
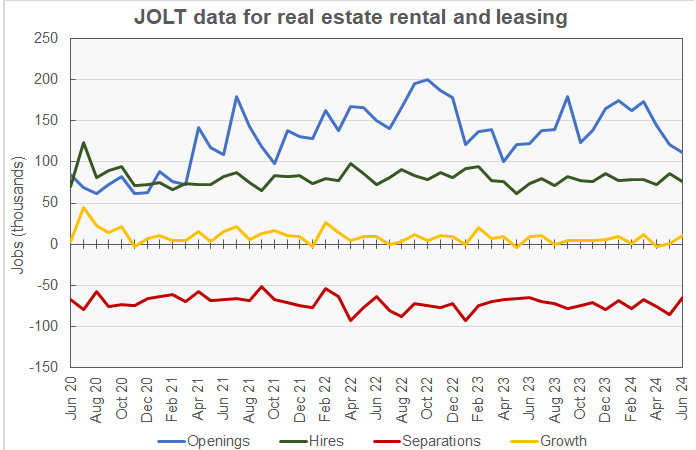
The number of job openings in the RERL category was reported to be 111,000 jobs at the end of June. This was down 10,000 job openings from the revised (+9,000) level of the month before. RERL job openings have been sliding since March and are down 9.8 percent year-over-year. Job openings in the RERL category represent 4.3 percent of total employment plus job openings.
Hiring in June was reported to be down by 10,000 jobs from May’s revised (+1,000) figure at 76,000 jobs. The hiring figure was up 2.7 percent from the level of the year before.
Total separations in the RERL jobs category in June were down by 20,000 from May’s revised (+1,000) figure at 65,000 jobs. While this is a low level of total separations, it was lower as recently as March 2022.
Quits were down by 6,000 from May’s unchanged figure at 40,000 jobs. Quits represented 61.5 percent of total separations in June. Layoffs were reported to fall by 12,000 from May’s revised (+1,000) figure to 22,000 jobs.
The numbers given in the JOLT report are seasonally adjusted and are subject to revision. It is common for adjustments to be made in subsequent reports, particularly to the data for the most recent month. The full current JOLT report can be found here.
Comparing the reports
The US labor market is very dynamic with many people changing jobs in any given month. The JOLT report documents this dynamism by providing details about job openings, hiring and separations. However, it does not break down the jobs market into as fine categories as does the Employment Situation Report, which provides data on total employment and unemployment. For example, while the Employment Situation Report separates residential construction from other construction employment, the JOLT report does not. The Employment Situation Report separates residential property managers from other types of real estate and rental and leasing professionals, but the JOLT report does not. However, the JOLT report provides a look at what is driving the employment gains (or losses) in broad employment categories.


