

CoStar reported that its value-weighted index of multifamily property prices rose 1.4 percent month-over-month in May, the first rise after 8 straight months of declines. In addition, last month’s reported decline of 1.4 percent was revised to near-breakeven based on new data in this month’s report. The multifamily property price index was down 8.3 percent year-over-year.
The value-weighted index of non-multifamily commercial property rose 1.0 percent, month-over-month, in May. This index fell 8.5 percent year-over-year. The other commercial property types tracked by CoStar are office, retail, industrial and hospitality.
For more information on the CoStar Commercial Repeat Sales Indexes (CCRSI’s), please see the description at the bottom of this report.
Multifamily property prices turn a corner
The first chart, below, shows the history of the value-weighted CCRSI’s since January 2016 for multifamily property and for all other commercial property considered as a single asset class. It also shows trend lines for the growth in the two CCRSI’s based on their growth in the period from January 2012 to January 2020. The indexes are normalized so that their values in December 2000 are set to 100.
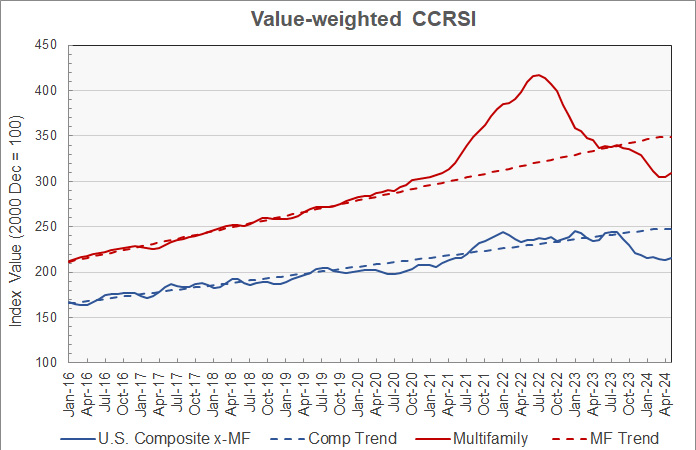
The chart shows that the growth in multifamily property prices had seemed to have returned to its pre-pandemic trend in the middle of 2023 before again entering a period of steep decline late in the year and into 2024.In the last two months, that decline seems to have bottomed out and a slight rebound may be underway. However, one month’s data does not establish a trend and new data in next month’s report may change the picture.
The rate of decline in prices for other commercial property types has also slowed recently, with two of the last 4 months showing gains. These prices are now 11.9 percent below their high point and 12.9 percent below their pre-pandemic trend. However, they are still 7.3 percent above their level in January 2020.
The second chart takes an expanded look at recent multifamily property pricing data as contained in this month’s and last month’s reports. It shows that last month’s data seemed to illustrate that multifamily property prices were continuing to fall steeply. However, revisions (downward) to March’s data and (upward) to April’s data indicated that the price decline had stopped, setting the stage for May’s price rise.
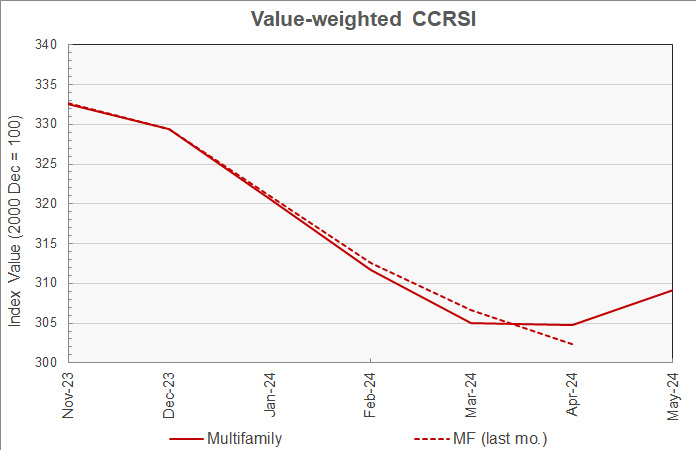
Note that this month’s report identified 32 additional sales transactions for March, on top of the 1,039 identified in last month’s report. It identified 189 additional sales transactions for April, on top of the 1,041 identified in last month’s report.
Transaction volumes edge lower
As noted above, an issue with monthly transaction volume reporting is that CoStar usually identifies additional transactions to tabulate over the next few months after the initial report, and these extra transactions tend to make initial reports of declining transaction volumes appear worse.
In May, CoStar reported that the transaction volume was up from the level initially reported for April but down slightly from the revised level for April listed in this month’s report.
CoStar reported that the initial transaction count for May was 1,207 repeat sales pairs. This was down 1.9 percent from the revised transaction count of 1,230 sales transactions in April. However, it is 15.9 percent, or 166 sales transactions, higher than the initial sales transaction count for April contained in last month’s report. Once the transaction counts for these months stabilize, which may be 4 to 6 months from now, it is likely that sales transactions will be up in May from April’s level.
CoStar counts 2.2 percent of May’s sales transaction as “distressed”.
The preliminary dollar volume of transactions was reported to rise 0.6 percent from the revised level of the month before to $8.43 billion. It was up 15.0 percent from the preliminary level reported last month.
The full report discusses all commercial property types. While the CoStar report provides information on transaction volumes, it does not break out multifamily transactions. The latest CoStar report can be found here.
CCRSI defined
The CoStar report focuses on a relative measure of property prices called the CoStar Commercial Repeat Sales Index (CCRSI). The index is computed based on the resale of properties whose earlier sales prices and sales dates are known. The index represents the relative change in the price of property over time rather than its absolute price. CoStar identified 1,207 repeat sale pairs in May for all property types. These sales pairs were used to calculate the results quoted here.
CoStar computes CCRSI’s for a variety of property groupings, combining them by cost, region, property type or other factors. The value-weighted index is more heavily influenced by transactions of expensive properties than is CoStar’s equal-weighted index. The value-weighted index is the focus of this report because it is an index whose value is reported monthly and for which CoStar breaks out multifamily property as a separate category.


