

Yardi Matrix reported that national average apartment asking rent was up $4 in June compared to the revised level of the month before at $1,739 per month. The national average year-over-year apartment asking rent growth was 0.6 percent in June, unchanged from the rate reported last month.
Rents in the “lifestyle” asset class, usually Class A properties, were down 0.4 percent year-over-year, while rents in “renter by necessity” (RBN) properties increased by 1.9 percent year-over-year. The chart, below, shows the history of the year-over-year rent growth rates for these two asset classes along with the difference between these rates.
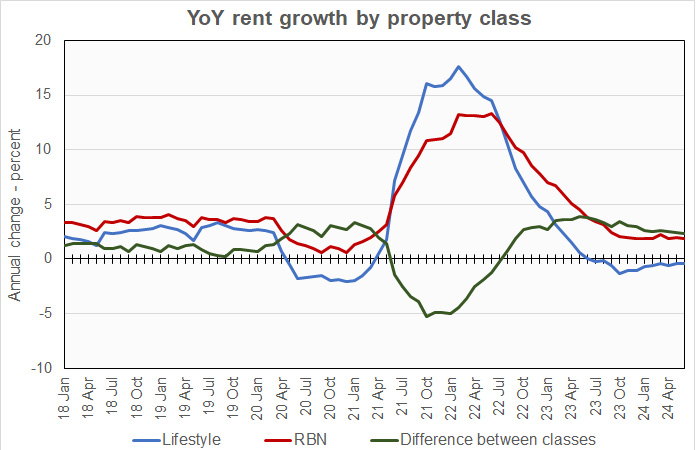
The chart shows that the year-over-year rent growth rate for lifestyle properties was negative again this month as the high level of new units hitting the market is concentrated in this category. Yardi Matrix expects 560,000 units to be delivered this year while absorptions is currently on a pace for about 300,000 units to be absorbed.
The year-over-year rent growth rates for both lifestyle and RBN properties have been occupying fairly stable ranges recently, although these ranges are quite different than the pre-pandemic norms.
Yardi Matrix reported that U.S. average occupancy rate in May was unchanged from its recent level at 94.5 percent. Of the top 30 metros on which Yardi Matrix reports, only Las Vegas saw occupancy increase year-over-year, rising 0.4 percentage points to 93.3 percent. Occupancy fell in all the other metros.
A focus on expenses
The discussion portion of the report looked at the role of expense growth in multifamily property operations today. Yardi Matrix reported that expense growth in 2023 declined slightly from 2022’s rate, falling 0.3 percentage points to 8.0 percent. This was despite a 29 percent rise in insurance expenses. Expenses grew most rapidly in metros with low expense levels. Expenses grew less rapidly in metros with high expense levels.
For reference, average annual expense growth was only 3.4 percent in the 2018-2021 period.
The report stated annualized expense growth through the early par of 2024 has been 4.2 percent, so the recent rapid rise in expense may be moderating.
Tabulating the data
Yardi Matrix reports on other key rental market metrics in addition to rent growth. These include the year-over-year job growth rate based on the 6 month moving average and the completions over the prior 12 months as a percentage of existing stock. The 10 metros with the largest annual apartment rent increases are listed in the table below, along with the other data.
| City | YoY rent | YoY jobs (6 mo moving avg) |
Completions as % of stock |
| New York | 4.8 | 1.1 | 1.1 |
| Columbus | 3.6 | 1.1 | 3.1 |
| Kansas City | 3.4 | 1.2 | 2.0 |
| New Jersey | 3.4 | 1.2 | 2.9 |
| Washington DC | 3.0 | 1.1 | 2.1 |
| Chicago | 2.8 | 0.4 | 1.8 |
| Boston | 2.6 | 0.6 | 2.3 |
| Detroit | 2.4 | 0.1 | 1.0 |
| Philadelphia | 2.4 | 1.5 | 1.8 |
| Indianapolis | 1.9 | 2.2 | 2.4 |
The major metros with the smallest year-over-year apartment rent growth as determined by Yardi Matrix are listed in the next table, below, along with the other data as in the table above.
| City | YoY rent | YoY jobs (6 mo moving avg) |
Completions as % of stock |
| Austin | (6.5) | 2.6 | 5.8 |
| Atlanta | (3.6) | 1.1 | 3.3 |
| Raleigh | (3.3) | 2.5 | 5.6 |
| Orlando | (2.8) | 2.2 | 5.3 |
| Phoenix | (2.8) | 2.4 | 3.3 |
| Charlotte | (2.3) | 1.6 | 5.5 |
| Nashville | (2.1) | 0.9 | 5.2 |
| Dallas | (2.0) | 2.0 | 2.9 |
| Tampa | (1.5) | 2.2 | 2.4 |
| San Francisco | (0.5) | 0.3 | 3.0 |
The top metros for month-over month rent growth in June were New York, Chicago, Kansas City and Portland. Only New York was in the top 4 in last month’s report. The trailing metros were Austin, Phoenix, Atlanta and Dallas. Only Phoenix was in the bottom 4 in last month’s report.
Single-family rentals see decline
Yardi Matrix also reported that single-family rental (SFR) rents fell $3 in June from the revised level of the month before to $2,166 per month. The year-over-year SFR rent growth rate fell 0.3 percentage points from the level reported last month to 1.1 percent.
Yardi Matrix reported on the top 34 metros for built-to-rent single family rentals, 23 of which saw rents grow year-over-year in June. The leading metro for year-over-year rent growth was Boston, with rent growth of over 25 percent. It was followed by Lansing and Raleigh, which each had rent growth of over 10 percent. San Diego and Indianapolis rounded out the top 5.
The metros with the lowest year-over-year rent growth were Phoenix, Baltimore, Washington D.C, Austin and Atlanta, which all saw rents fall year-over-year.
The national occupancy rate for single-family rentals in May rose 0.1 percentage point from the revised level of the month before to 95.4 percent.
This month, 14 of the metros saw year-over-year occupancy increases. The metros with the largest year-over-year occupancy increases were Washington D.C., Lansing, Seattle and Las Vegas. The metros with the greatest occupancy declines were Orlando, Baltimore, San Francisco and Atlanta.
The complete Yardi Matrix report provides information on some of the smaller multifamily housing markets and more information on the differences in results between lifestyle and RBN properties. It can be found here.


