

The latest rent report from Apartment List shows that the national median monthly rent growth in June was +0.4 percent. Year-over-year rent growth was -0.7 percent. Rents have now fallen on a year-over-year basis for more than a year.
Apartment List reported the national median apartment rent to be $1,411, up $7 from last month’s figure.
Charting the data
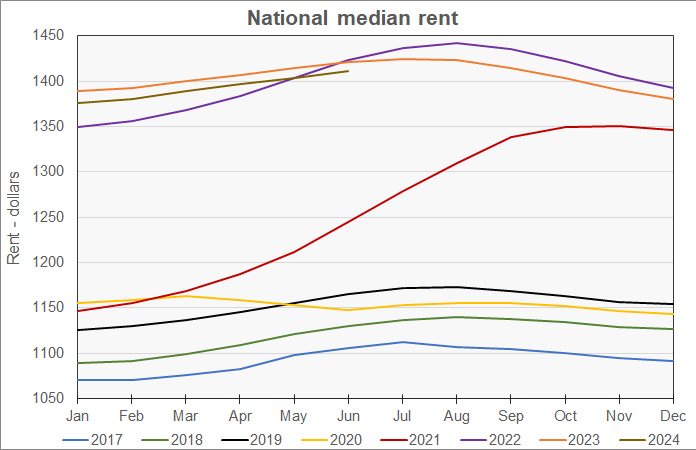
The first chart shows the history of the national median rent level since 2017. It is plotted year-by-year so that the annual change pattern is visible. The chart shows that rents in 2024 are continuing to parallel the path set by rents in 2023, but remain slightly below those earlier rents.
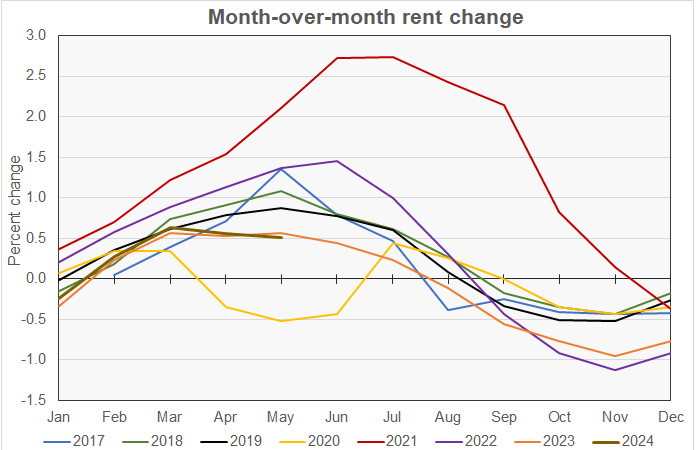
The next chart shows the rate of month-over-month rent growth, again plotted by year so that the annual pattern is visible. The chart shows that rent growth during the last two years is following the pattern of the pre-pandemic years, but at lower rates of growth than seen during those years. This is despite the fact that the general rise in price levels has been higher during the last two years than in the years leading up to the pandemic.
The next chart shows the year-over-year rate of rent growth since January 2018 plotted along with the national median apartment vacancy rate.
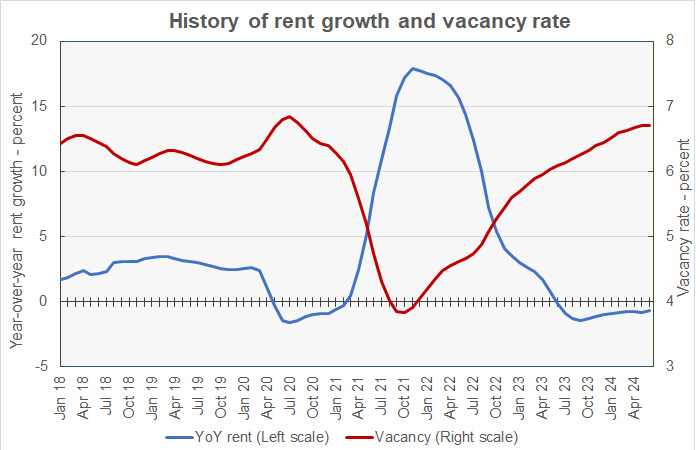
The chart shows that the national average vacancy rate, which had been rising steadily, flattened out recently. The current vacancy rate of 6.7 percent matches the readings of the last two months when expressed to one decimal point. It is about 40 basis points higher than the rates seen before the pandemic.
The chart also shows that year-over-year rent growth has now been negative for 13 months, the longest streak in Apartment List’s data set.
The final chart shows the change in the national median apartment rent since January 2017 in nominal dollar terms along with two other measures of rent accounting for changes in income and price levels. The Income adjusted curve adjusts the rent by the change in average hourly earnings as reported by the Bureau of Labor Statistics. The Inflation adjusted curve adjusts the rent by the general change in price level as measured by the not-seasonally-adjusted Consumer Price Index for all urban consumers (CPI-U).
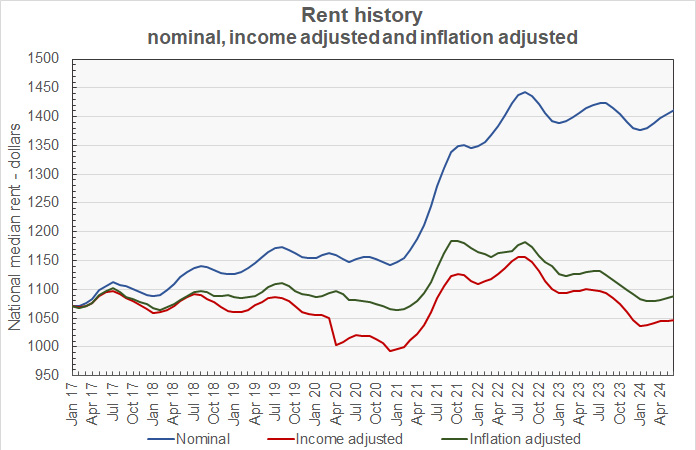
The curves show that, while rents have soared in nominal terms, when adjusted for wage growth or for the general increases in prices, they are close to their pre-pandemic levels. Since January 2017, average rents are up 31.7 percent while average hourly earnings are up 34.8 percent and inflation as measured by the CPI-U is up 29.5 percent.
Ranking the metros
Apartment List did not publish its underlying data tables this month so this report will not contain the listing of metros with the highest and lowest rates of rent growth.
The complete Apartment List report can be found here.


