The Census Bureau’s report on construction spending said that the value of multifamily residential construction put in place in June was up 0.14 percent from the revised level of the month before. Spending on single-family residential construction was reported to fall 1.24 percent while spending on improvements was up 0.59 percent.
The value of total private residential construction put in place in June 2024 was reported to be $928.0 billion on a seasonally adjusted, annualized basis. This figure, which includes spending on both new construction and on improvements, was reported to be down $3.1 billion month-over-month. However, May’s figure was revised higher by $12.9 billion, so this month’s figure is higher than that reported last month. Residential construction spending in June was reported to be up 7.3 percent year-over-year.
Multifamily construction spending reported higher after revision
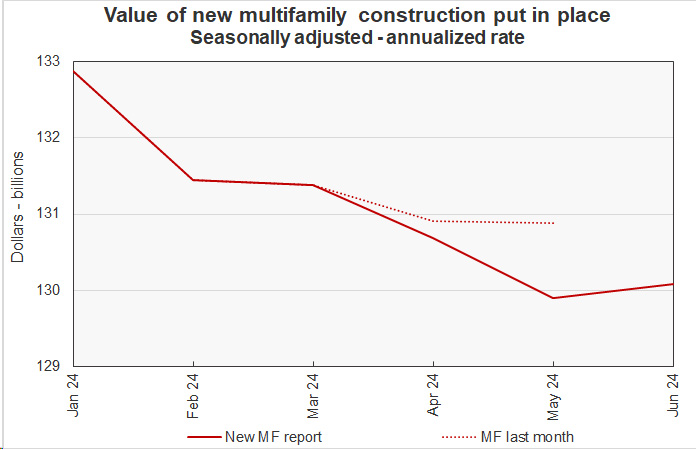
The value of new private construction of multifamily residential buildings put in place in May was reported to be $130.1 billion on a seasonally adjusted, annualized basis. This was up $181 million from the revised level for May. However, the May figure was revised lower by $981 million, so the preliminary multifamily construction spending figure reported this month is $800 million, or 0.8 percent, lower than the preliminary figure for May reported last month. The reported value of multifamily housing construction put in place in June 2024 was 7.4 percent lower than the level of June 2023.
The first chart shows the difference between the levels of multifamily construction put in place reported last month and the levels reported this month. It shows that the revisions to the data in this month’s report indicate a lower value of multifamily construction completions over the last two months than was presented in last month’s report.

For reference, the Census Bureau’s New Residential Construction report said the number of unit completions in June in buildings with 5 or more units rose 26.2 percent from the depressed level of the month before. Completions were 40.2 percent higher than their year-earlier level.
Governments were reported to have put $11.8 billion in residential construction in place in June on a seasonally adjusted annualized basis.
The value of new single-family residential construction put in place in June was $431.0 billion on a seasonally adjusted, annualized basis. This was down $5.4 billion from the revised (-$157 million) level for May but was up 9.9 percent from the level of June 2023.
The value of improvements to residential buildings put in place in June was reported to be $366.9 billion on a seasonally adjusted, annualized basis. This was up $2.14 billion from the revised (+$13.99 billion) level for May and was up $10.41 billion from the year-earlier level. The Census Bureau does not separate out improvements for single-family and multifamily residential buildings.
Charting the data
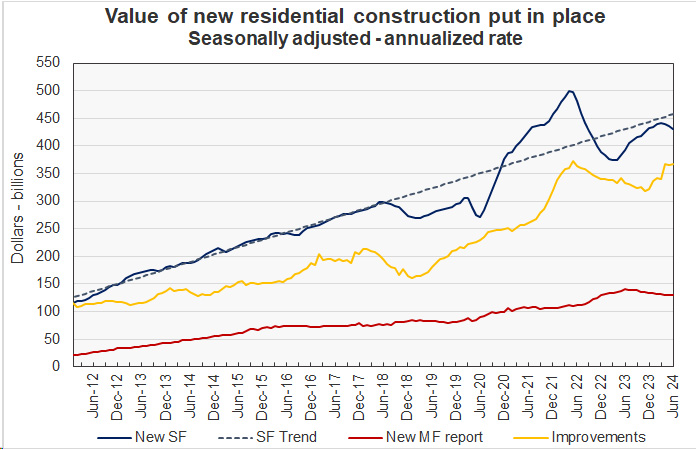
The following chart shows the value of residential construction put in place each month since January 2012. It also shows the trend line for single-family residential construction based on growth in construction volume during the period from January 2012 to June 2018.

The chart shows that the value of multifamily residential construction put in place, despite its reported rise this month, is now down 7.4 percent from its recent high of one year ago. This is the largest decline from a recent high since the 2010 low point in multifamily construction in the aftermath of the housing crash.
The data show that the value of single-family construction put in place slumped in the wake of the COVID pandemic but started a rebound in June 2023. However, the data also show that the value of single-family construction put in place has now been falling for the last three months.
The value of improvements put in place last month was revised sharply higher again in this month’s report. This tends to obscure the strength of the gain in construction spending on improvements in the headline figures. However, the chart shows that construction spending on improvements has held up better than either single-family or multifamily construction spending in recent months.
The report from the Census Bureau also includes information on spending on other types of construction projects. The full report can be found here.


