

CoStar reported that its value-weighted index of multifamily property prices fell 0.6 percent month-over-month in July after three months of gains. This index was down 9.2 percent year-over-year.
The value-weighted index of non-multifamily commercial property fell 1.4 percent month-over-month in July. This index is down 15.3 percent year-over-year. The other commercial property types tracked by CoStar are office, retail, industrial and hospitality.
For more information on the CoStar Commercial Repeat Sales Indexes (CCRSI’s), please see the description at the bottom of this report.
Multifamily property prices reverse recent trend
The first chart, below, shows the history of the value-weighted CCRSI’s since January 2016 for multifamily property and for all other commercial property considered as a single asset class. It also shows trend lines for the growth in the two CCRSI’s based on their growth in the period from January 2012 to January 2020. The indexes are normalized so that their values in December 2000 are set to 100.
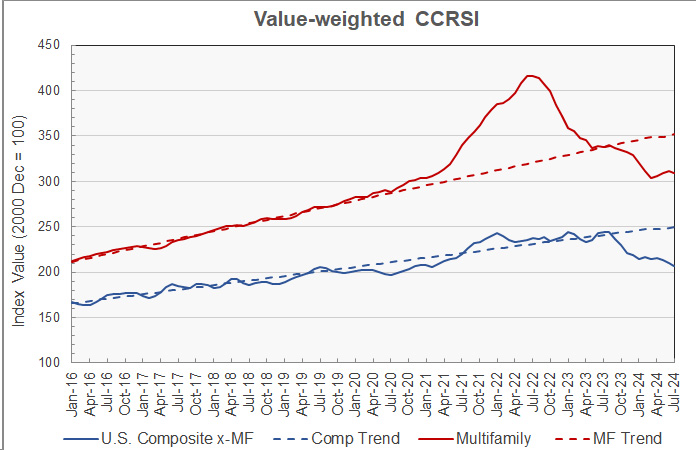
The chart shows the dip in multifamily property prices this month after their recent gains. Prices are still up 1.8 percent from their recent low in March. However, multifamily property prices are down 25.7 percent from the high they reached in the summer of 2022. They are 12.1 percent below their pre-pandemic trend.
Prices for other commercial property types have now fallen for three months in a row after a period of relative stability in the spring. These prices are now 15.3 percent below their high point and 17.1 percent below their pre-pandemic trend.
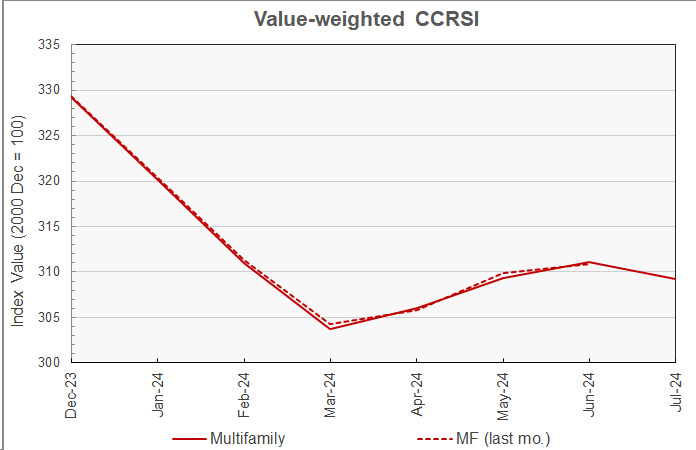
The second chart shows the recent history of multifamily property prices based on this month’s data along with the prices from last month’s report. While the number of transactions identified for all property types in June grew from 1,068 in last month’s report to 1,241 in this month’s report, the new data made only a slight difference in the estimated multifamily property price for June.
Transaction volumes reported lower
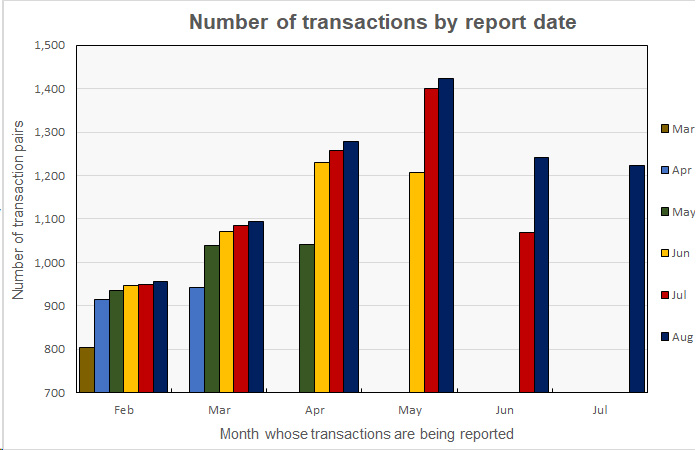
An issue with monthly transaction volume reporting is that CoStar usually identifies additional transactions to tabulate over the next few months after an initial report is released. These extra transactions tend to make initial reports of falling transaction volumes appear more negative than they will subsequently appear. For example, CoStar reported that the transaction volume in July was down 1.5 percent from the revised level of the month before. However, the transaction count was up 14.4 percent from the preliminary level for June reported last month.
CoStar reported that their initial transaction count for July was 1,222 repeat sales pairs.
The history of the revisions to the transaction counts for recent months is illustrated in the next chart. It shows that the number of transactions for February was initially given in the March report and has been revised in every subsequent report. However, the revision to the transaction count in the April report was by far the most significant. On the other hand, transaction data for July only appears in the August report. We can expect it to be revised next month.
The preliminary dollar volume of transactions was reported to fall 18.1 percent from the revised level of the month before to $7.81 billion. However, the decline from the preliminary level reported last month was only 9.8 percent.
Assessing liquidity
CoStar also included some measures of liquidity in this month’s report. Their data shows that the average number of days on market has been falling since the summer of 2021 and reached 172.5 days in the year to July 2024. The portion of properties withdrawn from being offered for sale rose to 26.3 percent, although CoStar did not provide previous reading for this metric.
The ratio of the sales price to the asking price was nearly unchanged at 92.9 percent. This metric is down from its recent high in the summer of 2022 but is in line with its pre-pandemic level.
The full report discusses all commercial property types. While the CoStar report provides information on transaction volumes, it does not break out multifamily transactions. The latest CoStar report can be found here.
CCRSI defined
The CoStar report focuses on a relative measure of property prices called the CoStar Commercial Repeat Sales Index (CCRSI). The index is computed based on the resale of properties whose earlier sales prices and sales dates are known. The index represents the relative change in the price of property over time rather than its absolute price. CoStar identified 942 repeat sale pairs in July for all property types. These sales pairs were used to calculate the results quoted here.
CoStar computes CCRSI’s for a variety of property groupings, combining them by cost, region, property type or other factors. The value-weighted index is more heavily influenced by transactions of expensive properties than is CoStar’s equal-weighted index. The value-weighted index is the focus of this report because it is an index whose value is reported monthly and for which CoStar breaks out multifamily property as a separate category.


