

Yardi Matrix reported that national average apartment asking rent was up $4 in July compared to the revised level of the month before at $1,743 per month. The national average year-over-year apartment asking rent growth was +0.8 percent, up 20 basis points from the rate reported last month.
Rents in the “lifestyle” asset class, usually Class A properties, were down 0.2 percent year-over-year, while rents in “renter by necessity” (RBN) properties increased by 2.0 percent year-over-year. Both of these rates are slight improvements from last month’s values. The chart, below, shows the history of the year-over-year rent growth rates for these two asset classes along with the difference between these rates.
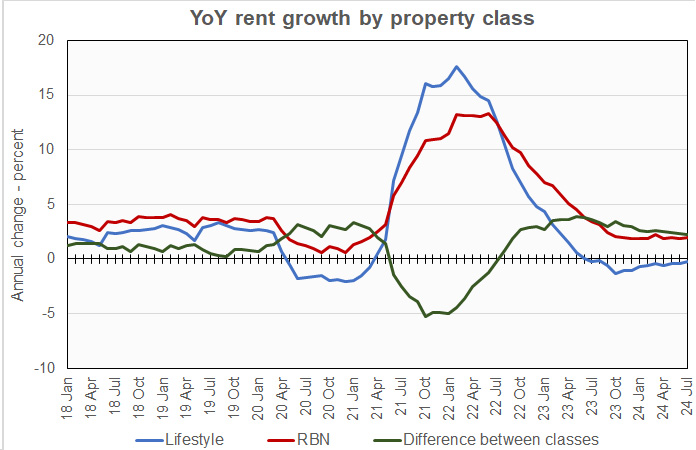
The chart shows that the year-over-year rent growth rate for lifestyle properties was negative again this month, extending a streak that began in July of last year.
The year-over-year rent growth rates for RBN properties is now about 1.5 percentage points lower than its average from 2018 and 2019. The year-over-year rent growth rate for lifestyle properties is 2.6 percentage points lower.
Yardi Matrix reported that U.S. average occupancy rate in June was up 10 basis points from last month’s level at 94.5 percent. Of the top 30 metros on which Yardi Matrix reports, only Las Vegas and the Twin Cities saw occupancy increase year-over-year. Occupancy rose 0.7 percentage points in Las Vegas to 93.6 percent and it rose 0.1 percent in the Twin Cities to 95.0 percent. Occupancy fell in all 28 other metros tracked in the Yardi Matrix report.
A focus on politics
The discussion portion of the report looked at the positions on housing that the two sides in the upcoming national election have taken, including President Biden’s plan for national rent control. The report concludes that there is good and bad in the positions of both parties but that neither party is likely to get its housing program passed unless the election puts the Presidency, the House and the Senate in the same hands.
Tabulating the data
Yardi Matrix reports on other key rental market metrics in addition to rent growth. These include the year-over-year job growth rate based on the 6 month moving average and the completions over the prior 12 months as a percentage of existing stock. The 10 metros with the largest annual apartment rent increases are listed in the table below, along with the other data.
| City | YoY rent | YoY rent last month |
YoY jobs (6 mo moving avg) |
Completions as % of stock |
| New York | 4.8 | 4.8 | 1.1 | 1.1 |
| Columbus | 3.6 | 3.2 | 1.1 | 3.1 |
| Kansas City | 3.4 | 3.4 | 1.2 | 2.0 |
| New Jersey | 3.4 | 3.1 | 1.2 | 2.9 |
| Washington DC | 3.0 | 3.0 | 1.1 | 2.1 |
| Chicago | 2.8 | 2.9 | 0.4 | 1.8 |
| Boston | 2.6 | 2.9 | 0.6 | 2.3 |
| Detroit | 2.4 | 1.8 | 0.1 | 1.0 |
| Philadelphia | 2.4 | 2.6 | 1.5 | 1.8 |
| Indianapolis | 1.9 | 2.6 | 2.2 | 2.4 |
The major metros with the smallest year-over-year apartment rent growth as determined by Yardi Matrix are listed in the next table, below, along with the other data as in the table above.
| City | YoY rent | YoY rent last month |
YoY jobs (6 mo moving avg) |
Completions as % of stock |
| Austin | (5.7) | (6.5) | 2.4 | 6.0 |
| Atlanta | (3.3) | (3.6) | 1.1 | 3.7 |
| Raleigh | (2.8) | (3.3) | 2.4 | 5.6 |
| Phoenix | (2.6) | (2.8) | 2.4 | 3.6 |
| Nashville | (2.3) | (2.1) | 0.8 | 5.2 |
| Orlando | (2.2) | (2.8) | 2.0 | 5.3 |
| Tampa | (1.7) | (1.5) | 2.0 | 2.6 |
| Charlotte | (1.6) | (2.3) | 1.4 | 5.2 |
| Dallas | (1.4) | (2.0) | 1.8 | 2.8 |
| San Francisco | (0.5) | (0.5) | 0.9 | 1.7 |
The top metros for month-over month rent growth in July were Washington D.C., New York, Austin and Dallas. Only New York was in the top 4 in last month’s report and Austin and Dallas were both in the bottom 4 last month, showing the volatility of this data. The trailing metros for month-over-month rent growth this month were Boston, Nashville, Chicago and Baltimore. None of these metros were in the bottom 4 in last month’s report.
SFR rent growth reverses last month’s decline
Yardi Matrix reported that single-family rental (SFR) rents rose $5 in July from the revised level of the month before to $2,171 per month. The year-over-year SFR rent growth rate fell 0.1 percentage points from the level reported last month to 1.0 percent.
Yardi Matrix reported on the top 34 metros for built-to-rent single family rentals, 21 of which saw rents grow year-over-year in July. The leading metro for year-over-year rent growth was Boston, with rent growth of around 20 percent. It was followed by Lansing and Raleigh, which had rent growth of nearly 10 percent. San Diego and Portland rounded out the top 5.
The metros with the lowest year-over-year rent growth were Baltimore, Phoenix, Atlanta, Washington D.C, and Tampa, which all saw rents fall year-over-year.
The national occupancy rate for single-family rentals in May rose 0.1 percentage point from the revised level of the month before to 95.4 percent.
This month, 14 of the metros saw year-over-year occupancy increases. The metros with the largest year-over-year occupancy increases were Washington D.C., Orlando, Lansing and Seattle. Orlando had the largest year-over-year occupancy decline in last month’s report but somehow managed to rise to second place for occupancy growth in this month’s report. The metros with the greatest occupancy declines were Indianapolis, San Francisco, Baltimore and Nashville.
The complete Yardi Matrix report provides information on some of the smaller multifamily housing markets and more information on the differences in results between lifestyle and RBN properties. It can be found here.


