

The latest rent report from Apartment List shows that the national median monthly rent growth in August was -0.1 percent. Year-over-year rent growth was -0.74 percent. Rents have fallen on a year-over-year basis since June 2023.
Apartment List reported the national median apartment rent to be $1,412, down $2 from last month’s revised figure.
Charting the data
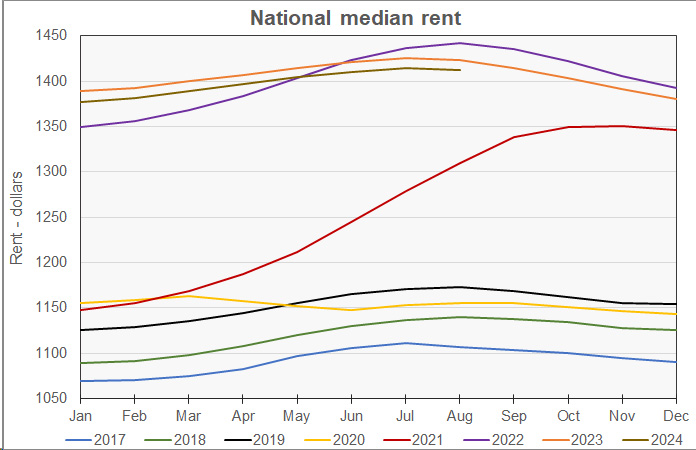
The first chart shows the history of the national median rent level since 2017. It is plotted year-by-year so that the annual change pattern is visible. The chart shows that rents in 2024 have been following the pattern of the year before to a remarkable degree. They have been consistently about 0.8 percent lower throughout the year.
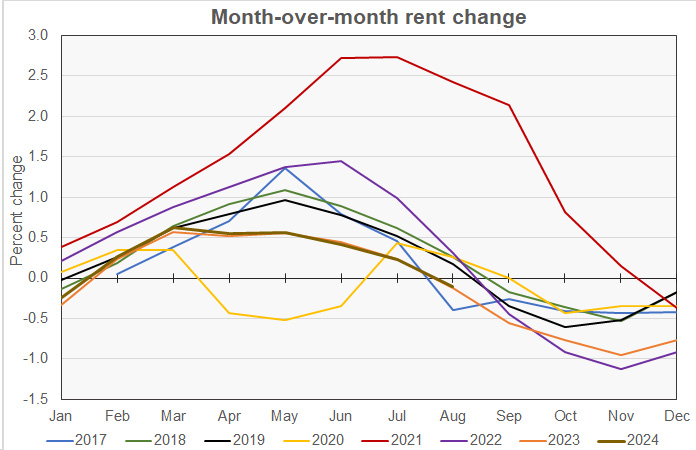
The next chart shows the rate of month-over-month rent growth, again plotted by year so that the annual pattern is visible. The chart shows that the last two years of month-over-month rent growth have tracked more closely than have any other two years in the data set. It also shows that the month-over-month rent growth rates for August of these two years are the lowest of any August tracked by Apartment List except for 2017.
The next chart shows the year-over-year rate of rent growth since January 2018 plotted along with the national median apartment vacancy rate.
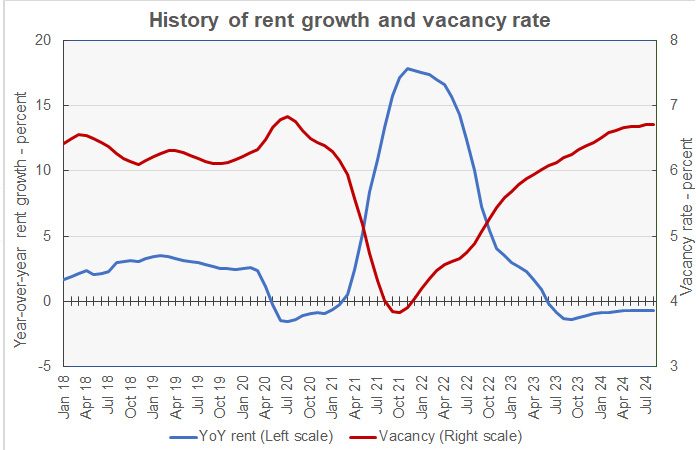
The chart shows that the national average vacancy rate may be reaching a plateau given that this month’s growth in the vacancy rate is only 0.003 percentage points. However, if the three pre-pandemic years in the Apartment List data set can be considered to be “normal”, then the peak annual vacancy rate normally occurs in March with the annual minimum occurring in November. A late summer/early fall vacancy rate peak would be unusual.
The final chart shows the change in the national median apartment rent since January 2017 in nominal dollar terms along with two other measures of rent accounting for changes in income and price levels. The Income adjusted curve adjusts the rent by the change in average hourly earnings as reported by the Bureau of Labor Statistics. The Inflation adjusted curve adjusts the rent by the general change in price level as measured by the not-seasonally-adjusted Consumer Price Index for all urban consumers (CPI-U).
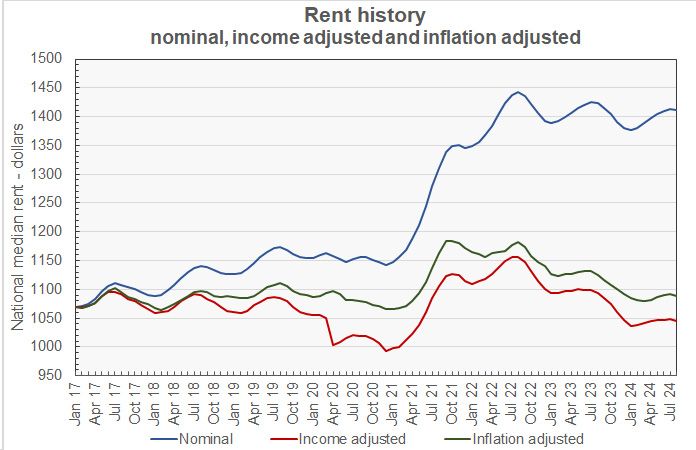
The curves show that, after the shocking rise in rents which occurred in 2021, rents have been trending lower in inflation-adjusted and income-adjusted terms. Since January 2017, average rents are up 32.0 percent while average hourly earnings are up 35.2 percent and inflation as measured by the CPI-U is up 29.6 percent.
Ranking the metros
Apartment List provides the underlying data they collected in compiling their report and that data was used to create the tables, below. The tables look at the 50 most populous metropolitan statistical areas defined by the US Census Bureau and identify the top and bottom 10 metros for year-over-year rent growth. The tables provide the median monthly rent in the metro, the metro’s vacancy rate, the annual percentage change in rent (YoY Metro) along with the percentage change from the prior month’s rent level (MoM Metro). They also list the percentage changes in rent for the metro areas compared to the rent levels in February 2020, right before the pandemic struck (Feb 20).
The first table shows the 10 metros with the largest annual rent percentage increases. Many of these cities are in the northern “rust belt”. The average of the vacancy rates in these metros is 5.5 percent.
| Metro | Metro Rent | Vacancy rate | YoY Metro | MoM Metro | Feb 20 |
| Cleveland | $1,118 | 5.8 | 5.9 | (0.44) | 29.5 |
| Louisville | $1,222 | 5.2 | 4.5 | (0.56) | 27.0 |
| Hartford | $1,570 | 4.6 | 4.5 | 0.32 | 35.3 |
| Virginia Beach | $1,584 | 4.5 | 4.0 | 0.39 | 34.0 |
| Grand Rapids | $1,274 | 8.0 | 3.8 | 1.39 | 38.2 |
| Washington | $2,203 | 5.3 | 3.5 | 0.22 | 18.8 |
| Milwaukee | $1,238 | 5.7 | 3.4 | (0.01) | 27.1 |
| Detroit | $1,231 | 4.9 | 3.1 | 0.08 | 23.1 |
| Pittsburgh | $1,195 | 6.7 | 2.9 | (0.13) | 18.9 |
| Providence | $1,466 | 4.5 | 2.5 | 0.13 | 39.8 |
The next table shows the 10 metros with the smallest annual rent increases. Many of these cities are seeing high levels of new product coming to market. The average of the vacancy rates in these metros is 7.9 percent.
| Metro | Metro Rent | Vacancy rate | YoY Metro | MoM Metro | Feb 20 |
| Austin | $1,430 | 9.3 | (7.5) | (0.78) | 13.2 |
| Raleigh | $1,448 | 8.8 | (4.8) | (0.62) | 24.3 |
| Jacksonville | $1,373 | 7.4 | (4.4) | (0.47) | 24.5 |
| Atlanta | $1,477 | 7.5 | (4.2) | (0.22) | 20.5 |
| Charlotte | $1,371 | 8.0 | (3.5) | (0.13) | 22.6 |
| San Diego | $2,291 | 6.0 | (3.4) | (0.31) | 29.7 |
| San Antonio | $1,254 | 8.9 | (3.1) | 0.07 | 16.5 |
| Dallas | $1,478 | 8.2 | (3.1) | (0.23) | 21.0 |
| Phoenix | $1,447 | 7.5 | (2.9) | (0.26) | 25.3 |
| Orlando | $1,584 | 6.8 | (2.2) | (0.05) | 26.5 |
In August, 30 of the 50 most populous metros saw their rents rise on a year-over-year basis. In addition, 24 metros saw rents rise on a month-over-month basis, down from 44 last month. San Francisco remains the only metro of the top-50 that has rents that are below their level in February 2020, immediately before the pandemic.
The complete Apartment List report covers many more metros and also provides city, county and state data. It gives readers with the opportunity to download their data sets. The latest report can be found here.


