

The producer price index (PPI) report from the Bureau of Labor Statistics (BLS) stated that construction materials prices were up 0.2 percent month-over-month in August on a seasonally adjusted basis. However, the change in construction materials prices for July was revised to a 0.2 percent decline from the last month’s report of a 0.1 percent increase, the same revision as took place in last month’s report. The index of components and materials for construction was up 0.9 percent from its year-earlier level.
Overall prices for processed goods for intermediate demand were down 0.1 percent for the month. The volatile prices of processed fuels and lubricants fell 0.6 percent. The overall processed goods for intermediate demand index was 1.1 percent lower than its year-earlier level.
For reference, the changes in these indexes compare with a 2.5 percent rise in the all-items consumer price index (CPI-U) for the 12 months ending in August.
Yield Pro compiled the BLS reported changes for our standard list of construction materials prices. These are prices of materials which directly impact the cost of constructing an apartment building. The first two right hand columns of the table provide the percent change in the price of the commodity from a year earlier (12 Mo PC Change) and the percent change in price from July (1 Mo PC Change). If no price data is available for a given commodity, the change is listed as N/A.
The pre-COVID column lists the change in the current construction materials prices relative to the average of prices from December 2019 through February 2020, before the pandemic impacted the economy. This provides a longer-term view of construction materials price trends.
| Commodity | 12 Mo PC Change | 1 Mo PC Change | Pre-covid Change |
| Softwood lumber | (6.1) | 3.1 | 12.2 |
| Hardwood lumber | 6.0 | 0.2 | 31.3 |
| General millworks | 2.5 | 0.1 | 31.1 |
| Soft plywood products | (7.1) | 0.7 | 55.4 |
| Hot rolled steel bars, plates and structural shapes | (8.7) | (1.3) | 45.5 |
| Copper wire and cable | 7.7 | (5.1) | 39.4 |
| Power wire and cable | (3.2) | 0.9 | 135.1 |
| Builder’s hardware | (0.9) | 0.0 | 24.4 |
| Plumbing fixtures and fittings | 1.8 | 0.0 | 19.8 |
| Furnaces and heaters | 1.9 | 0.0 | 37.4 |
| Sheet metal products | 0.9 | (0.1) | 48.2 |
| Electrical Lighting fixtures | 2.1 | 1.0 | 20.7 |
| Nails | (9.2) | (0.1) | 18.4 |
| Major appliances | 1.2 | 1.9 | 23.7 |
| Flat glass | 2.8 | 1.3 | 34.3 |
| Ready mix concrete | 4.2 | (0.2) | 36.2 |
| Asphalt roofing and siding | 1.2 | (1.2) | 40.4 |
| Gypsum products | 4.2 | 0.0 | 47.7 |
| Mineral wool insulation | 5.9 | (0.2) | 49.1 |
| CPI-U (unadjusted) | 2.5 | 0.1 | 22.1 |
The prices used by the BLS in compiling the indexes are collected on the Tuesday of the week containing the 13th day of the month. In August that would have been August 13. In the September report, the data collection date will be September 10.
The first chart, below, shows the price index history for wood products over the past 37 months.
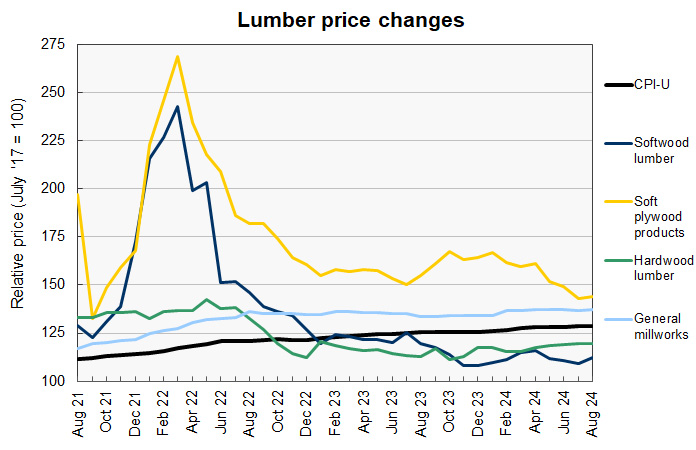
The price index for softwood lumber has been trending lower since reaching its recent high in July 2023. However, lumber prices jumped 3.1 percent this month, the largest increase of any of the construction materials prices that we track. There have been other price jumps during the downward trend, so it is not clear that this rise represents the start of a new upward trend.
The price index for soft plywood products was reported to rise by 0.7 percent this month. However, the price index for July was revised lower by 1.9 percent so the index is actually lower than its level reported last month.
The next chart, below, shows the recent history of several other construction materials prices. These are relatively simple commodities whose prices are strongly driven by those of the materials of which they are comprised.
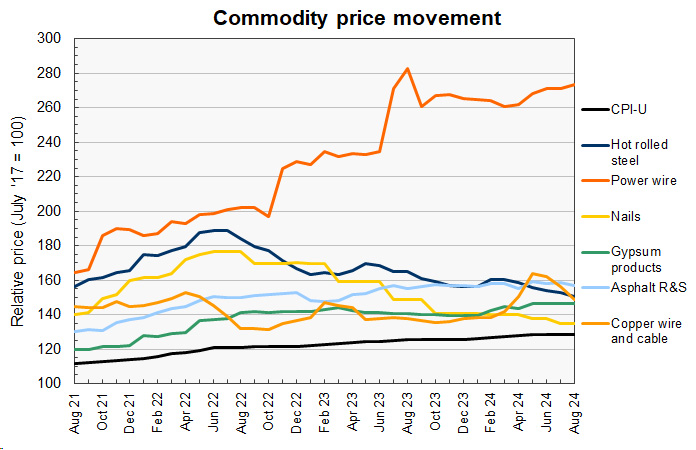
The price index for copper wire was reported to fall 5.1 percent this month. This is the largest drop of any of the construction materials prices that we track. In addition, the price index for July was revised lower by 0.8 percent, so its fall is even larger than the headline figure would suggest. By contrast, the price index for power wire and cable continued to climb in August. It remains the most elevated relative to its pre-pandemic level of the prices we track.
Prices for nails and for hot-rolled steel bars continued their declines this month. They have been on downward trends since the summer of 2022.
Price changes for several of the more finished goods from our sample are illustrated in the final chart, below.
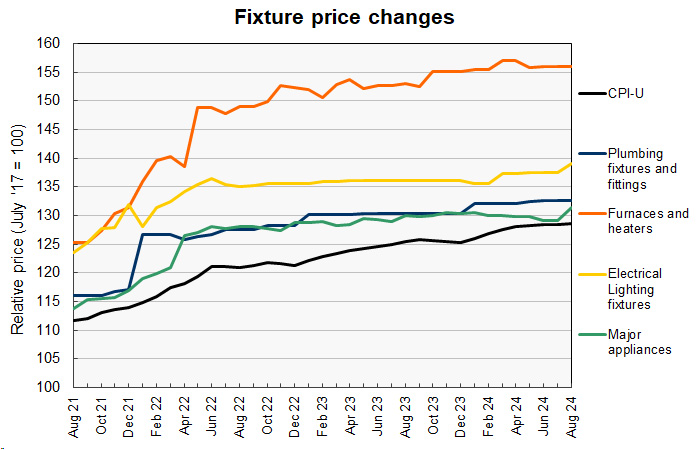
The price indexes for several of these goods have been almost unbelievably stable recently. For example, in this month’s report, the price indexes for both plumbing fixtures and fittings and for furnaces and heaters, which are quoted to 6 digits, are listed as being exactly the same for the last three months.
The price index for major appliances was reported to rise 1.9 percent this month, the second largest increase of any of the construction martials prices that we track. The price index for electrical lighting fixtures also took a significant jump this month, rising 1.0 percent.
The full current BLS report can be found here.


