

The latest commercial property price report from MSCI Real Capital Analytics said that multifamily property prices rose 0.1 percent in August from their level of the month before. This is the first increase since July 2022. However, prices were down 5.7 percent from their level of one year ago.
Defining CPPI
MSCI tracks an index called the Commercial Property Price Index (CPPI). The index is computed based on the resale prices of properties whose earlier sales prices and sales dates are known. The index represents the relative change in the price of property over time rather than its absolute price. Note that, as new properties are added to the MSCI dataset each month, they recalculate the CPPI, potentially all the way back to the beginning of the data series.
Multifamily property prices break through
The first chart, below, shows how the CPPI’s for all commercial property as a single asset class and for apartments have changed since January 2016. To simplify the comparison, both CPPI’s have been normalized to values of 100 in January 2012. The chart also contains trend lines showing the straight-line average rates of price appreciation for the two asset classes based on their performances from January 2012 to December 2019.
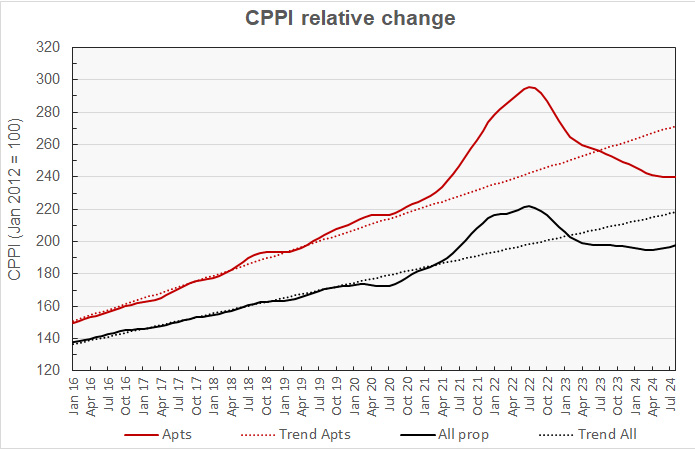
The chart shows that multifamily property prices have been falling for two years and have been below their pre-pandemic trend line since February 2023. This month, both multifamily property prices and general commercial property prices turned upward but they aren’t close to returning to their pre-pandemic trends.
Multifamily property prices are now down 18.9 percent from their peak but are 13.2 percent above their level in January 2020. They are 11.7 percent below their pre-pandemic trend line.
Prices for all commercial property as a single asset class are down 10.7 percent from their peak but are 14.3 percent above their level in January 2020. They are 9.3 percent below their pre-pandemic trend.
The next chart plots the month-over-month changes in the values of the CPPI over the last 25 months for all commercial property as a single asset class and for apartments. It also includes the same metrics based on the data included in last month’s report.
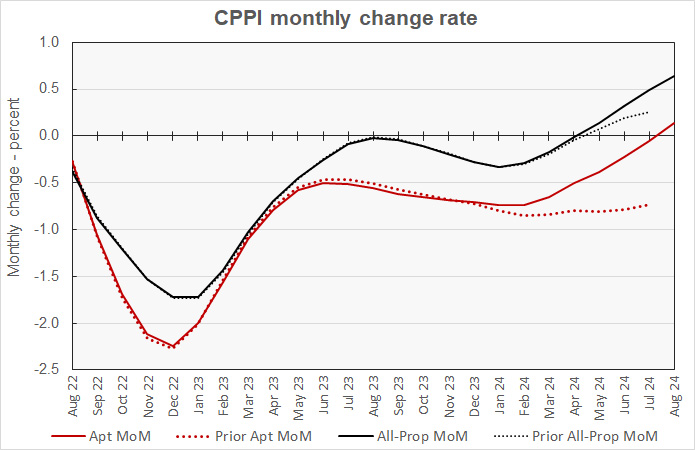
The chart shows that updates to last month’s data were positive for both multifamily property and for commercial property price trends. The revisions had noticeable effects on the last 7 months of data for multifamily property and the last 5 months of data for general commercial property.
The current month’s data shows that multifamily property prices have been declining at progressively lower rates since last February and broke through to growth this month. However, in recent months, revisions to the prior month’s data have alternated between upward and downward adjustments. This month, the revision moved prices upward, but next month’s revisions to the data could change the picture.
The chart shows that overall commercial property prices have been rising for the last 4 months, and at faster pace than indicated in last month’s report.
Multifamily continues to trail all but CBD offices
August’s data indicate that the month-over-month decline in multifamily property prices was only exceeded by that for offices within central business districts (CBDs). Those prices declined 1.5 percent for the month.
Suburban office property saw the largest monthly price gain in August with a rise of 0.5 percent. Industrial property continued to show steady growth, but only at a rate of 0.4 percent for the month. Prices for retail property rose 0.3 percent for the month.
Industrial property continued to be the best performing property type on a year-over-year basis, with prices rising 6.9 percent. Prices for offices within CBDs were down 27.4 percent while prices for suburban offices fell 4.7 percent. Prices for retail property rose 0.8 percent.
Major metro commercial property prices rise
The MSCI report provides data comparing the price changes of commercial property in 6 major metro* areas against those in the rest of the country, although it does not separate out apartments from other commercial property types in this comparison. The next chart, below, plots the history of the relative price indexes since January 2016 for both market segments, along with trend lines based on straight-line fits to the changes in these indexes between January 2012 and December 2019. For purposes of this chart, both price indexes were set to values of 100 for January 2012.
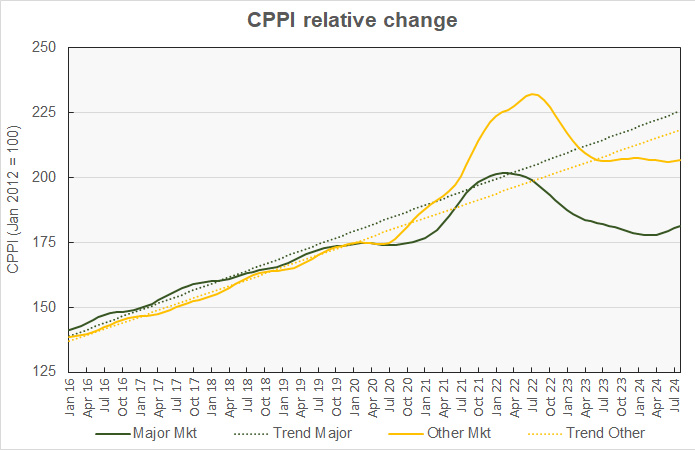
The chart shows that the CPPI for major metro commercial property is up 0.6 percent month-over-month and 0.1 percent year-over-year. It has fallen 10.0 percent from its peak but is now 4.1 percent above its level in January 2020. It is 19.6 percent below its long-term trend.
The other markets CPPI is up 0.2 percent month-over-month and 0.1 percent year-over-year. It has now fallen 11.0 percent from its peak but is 18.3 percent above its level in January 2020. The non-major metro CPPI is 5.4 percent below its pre-pandemic trend.
The final chart plots the history of the month-over-month changes in the price indexes for the two property markets over the last 25 month along with last month’s monthly price change data.
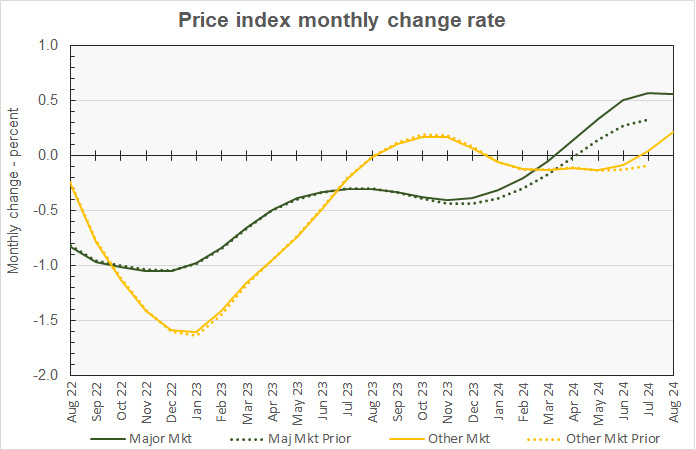
The chart shows that revisions to last month’s pricing data for both market segments were to the upside this month. For major markets, the updated data made a noticeable difference as far back as last November. For the non-major metros significant revisions only occurred in the data from the last two months.
By the numbers, price appreciation for commercial property in major metros was reported to be +0.6 percent for the month and +1.6 percent for the year. Prices for commercial property in non-major markets were reported to be up 0.2 percent for the month and also up 0.2 percent year-over-year.
The full report provides more detail on other commercial property types. Access to the MSCI Real Capital Analytics report can be obtained here.
*The major metros are Boston, Chicago, Los Angeles, New York, San Francisco and Washington DC.


