

Yardi Matrix reported that national average apartment asking rent was down $1 in August compared to the revised level of the month before at $1,741 per month. The national average year-over-year apartment asking rent growth was +0.8 percent in August, unchanged from the rate reported last month.
Rents in the “lifestyle” asset class, usually Class A properties, were down 0.1 percent year-over-year, while rents in “renter by necessity” (RBN) properties increased by 1.9 percent year-over-year. The lifestyle rent growth is up 0.1 percentage point from last month’s rate while the RBN rent growth is down 0.1 percentage point from last month’s rate. The chart, below, shows the history of the year-over-year rent growth rates for these two asset classes along with the difference between these rates.
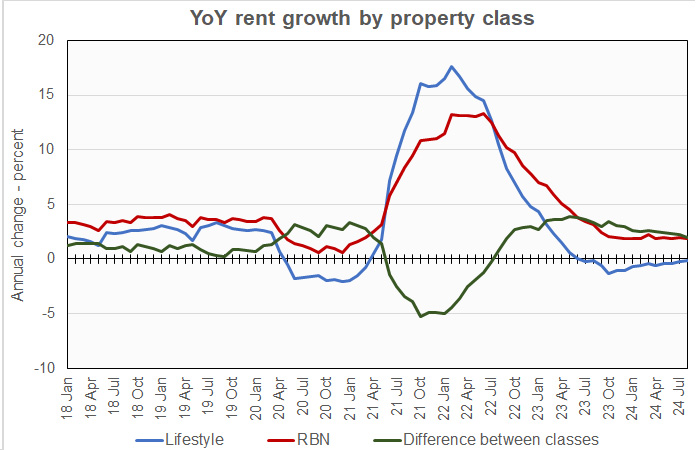
The chart shows that the year-over-year rent growth rate for lifestyle properties continued its negative streak but is within a whisker of reaching break-even. The difference between the rent growth rates for the two property classes remains much wider than was typical before the pandemic. However, it has been declining recently, which may indicate that market conditions are slowly returning to their pre-pandemic pattern.
Yardi Matrix reported that the U.S. average occupancy rate in July was up 20 basis points from the level in last month’s report at 94.7 percent. However, the new report states that the occupancy rate has been at that level for the four straight months, indicating that unreported revisions have taken place for past data. The 94.7 percent occupancy rate was reported to be down 0.3 percentage points year-over-year.
Of the top 30 metros on which Yardi Matrix reports, 7 saw occupancy rates increase year-over-year. This is up from only 2 last month. Las Vegas was the occupancy growth leader with a year-over-year gain of 0.9 percentage points to 93.6 percent. Occupancy fell for the 23 other metros, with Houston experiencing the largest drop at -0.7 percentage points year-over-year.
Hope for rising activity
The discussion portion of the report looked at the implications for the market of the anticipated interest rates cuts signaled by Fed chairman Jerome Powell. The report notes that the current yields on many multifamily properties are lower than current interest rates, discouraging transactions. That deals are taking place with negative leverage indicates that buyers are expecting rents to grow again once the current surge in new supply ebbs. However, a drop in interest rates is expected to allow more deals to take place. It should also make it easier for properties that are in need of refinancing to get new loans.
Tabulating the data
Yardi Matrix reports on other key rental market metrics in addition to rent growth. These include the year-over-year job growth rate based on the 6 month moving average and the completions over the prior 12 months as a percentage of existing stock. The 10 metros with the largest annual apartment rent increases are listed in the table below, along with the other data.
| City | YoY rent | YoY rent last month |
YoY jobs (6 mo moving avg) |
Completions as % of stock |
| New York | 4.8 | 5.2 | 1.1 | 1.4 |
| Kansas City | 4.1 | 3.4 | 1.3 | 1.9 |
| Washington DC | 3.4 | 4.0 | 0.7 | 2.0 |
| Indianapolis | 3.0 | 2.7 | 2.0 | 2.5 |
| Boston | 2.9 | 2.1 | 0.5 | 2.4 |
| Columbus | 2.9 | 2.9 | 0.6 | 3.6 |
| New Jersey | 2.9 | 2.9 | 1.2 | 2.3 |
| Chicago | 2.1 | 2.0 | 0.1 | 1.6 |
| Detroit | 2.0 | 1.9 | 0.1 | 0.9 |
| Seattle | 2.0 | 2.1 | 1.1 | 3.6 |
The major metros with the smallest year-over-year apartment rent growth as determined by Yardi Matrix are listed in the next table, below, along with the other data as in the table above.
| City | YoY rent | YoY rent last month |
YoY jobs (6 mo moving avg) |
Completions as % of stock |
| Austin | (5.5) | (5.7) | 2.2 | 6.2 |
| Raleigh | (3.4) | (2.8) | 2.4 | 5.9 |
| Phoenix | (2.9) | (2.6) | 2.2 | 4.1 |
| Atlanta | (2.7) | (3.3) | 1.0 | 4.2 |
| Orlando | (2.7) | (2.2) | 1.7 | 5.1 |
| Charlotte | (1.9) | (1.6) | 1.5 | 4.9 |
| Tampa | (1.9) | (1.7) | 1.9 | 3.0 |
| Nashville | (1.7) | (2.3) | 0.6 | 5.6 |
| Dallas | (1.5) | (1.4) | 1.7 | 2.9 |
| San Francisco | (0.8) | (0.4) | 0.5 | 2.9 |
The top metros for month-over month rent growth in August were Kansas City, Boston, Indianapolis and Baltimore. None of these metros was in the top 4 in last month’s report and Boston and Baltimore were in the bottom 4, showing the volatility of this data. The trailing metros this month were Raleigh, Las Vegas, Phoenix and Orlando. None of these metros were in the bottom 4 in last month’s report.
Single-family rentals see decline
Yardi Matrix also reported that single-family rental (SFR) rents fell $7 in August from the revised level of the month before to $2,164 per month. The year-over-year SFR rent growth rate fell 0.3 percentage points from the level reported last month to 0.7 percent. The report states that a decline in rents on lifestyle properties is leading the overall decline.
Yardi Matrix reported on the top 34 markets for built-to-rent single family rentals, 17 of which saw rents grow year-over-year in August. The leading markets for year-over-year rent growth were Raleigh, South Dakota, Kansas City and Twin Cities. In a break from the performance of recent months, none of them saw double-digit rent growth.
The markets with the lowest year-over-year rent growth were Pensacola, Phoenix, Atlanta, and Tampa, which all saw rents fall year-over-year.
The national occupancy rate for single-family rentals in July fell 0.1 percentage point from the level of the month before to 95.3 percent.
This month, 14 of the metros saw year-over-year occupancy increases. The metros with the largest year-over-year occupancy increases were Pensacola, Columbus, Tampa and San Antonio. The metros with the greatest occupancy declines were Jacksonville, Indianapolis, Charleston and Cleveland.
The complete Yardi Matrix report provides information on some of the smaller multifamily housing markets and more information on the differences in results between lifestyle and RBN properties. It can be found here.


 lead new project starts")


