Fannie Mae’s November housing forecast calls for multifamily housing starts to bottom out at the end of 2024 and then to steadily increase through the rest of the forecast horizon. Despite the growth, the starts rate for Q4 2026 will still be significantly below the rates seen in 2022 and early 2023.
For the first time, this month’s forecast provides estimates for 2026.
The forecast for single-family housing starts was revised higher in the near term but lower further out. Starts are expected to reach a low point in Q1 2025 and then to rise through the end of 2026.
Fannie Mae’s forecasters expect the Fed Funds rate to average 4.6 percent in Q4 2024, the same as in last month’s forecast. Fannie Mae’s forecasters expect the rate to fall to an average of 3.9 percent in Q4 2025, higher than the estimate of 3.3 percent last month. The rate is expected to then slowly decline though 2026, reaching a level of 3.4 percent in Q4.
Estimates for the 10-year Treasury were revised higher again this month. It is now predicted to have reached a low of 3.9 percent in Q3 2024 and to go up from there. The rate is expected to rise to 4.2 percent in Q4 and then to slowly continue higher, reaching 4.4 percent by the end of 2026. The 2025 rates are generally about 0.5 percentage point higher than those predicted in last month’s outlook. To the extent that mortgage rates are driven by the 10-year Treasury rate, this would be bad news for people looking for financing.
Multifamily starts forecast reduced
The current forecast for multifamily housing starts is shown in the first chart, below, along with three other recent forecasts. Fannie Mae considers any building containing more than one dwelling unit to be “multifamily”, including both condominiums and rental housing units.
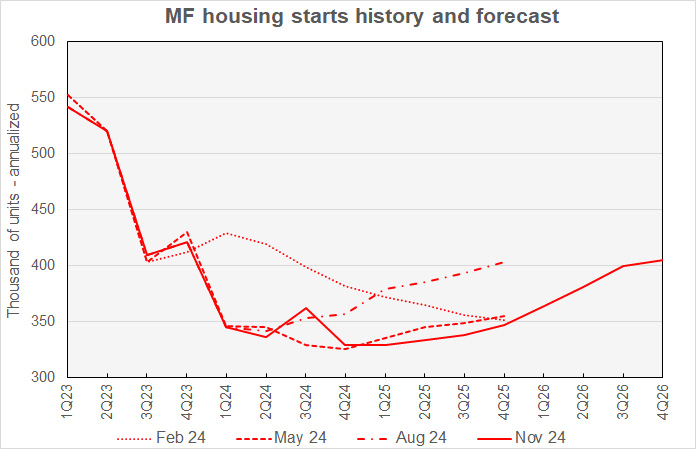
For the third month in a row, revisions to Fannie Mae’s multifamily housing starts forecasts were to the downside this month. The forecasters revised starts in Q4 2024 lower by 16,000 annualized units and revised starts in each quarter of 2025 lower by 26,000 or more annualized units. However, the initial starts forecast for 2026 shows star rising throughout the year.
The low point for multifamily starts is now seen as being in Q4 2024 and Q1 2025, each predicted to see 329,000 annualized starts. The forecast then calls for multifamily housing starts to rise throughout the remainder of the forecast period, ending at 405,000 annualized unit starts in Q4 2026. However, as recently as Q2 2023, multifamily housing starts exceeded a rate of 500,000 units per year.
For reference, the most recent new residential construction report from the Census Bureau has multifamily starts running at a seasonally-adjusted annualized rate of 476,000 units in Q3. Starts were 448,000 annualized units in the first month of Q4 2024.
Looking at yearly forecasts, the predicted number of multifamily starts for 2025 was revised lower by 27,000 units to 337,000 units. The initial forecast for multifamily starts in 2026 was for 387,000 units.
Single-family starts forecast revised upward
The current forecast for single-family housing starts is shown in the next chart, below, along with three other recent forecasts.
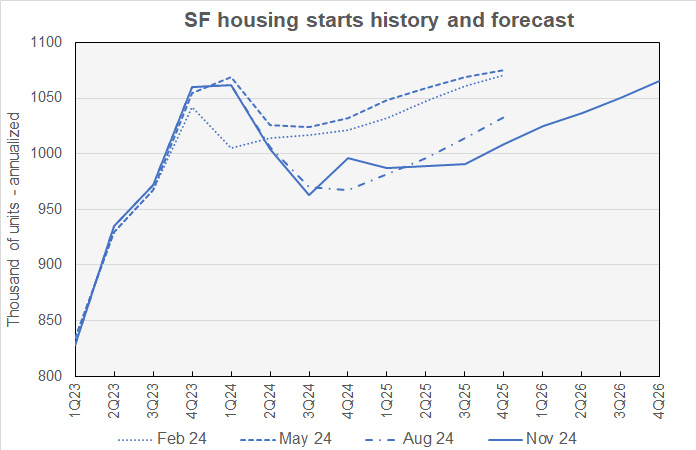
The single-family starts forecasts were revised higher through Q1 2025 but lower for the last 3 quarters of 2025. Quarterly single-family starts were forecast to rise from their rate in Q2 2025 through the end of 2026.
The low point for single-family starts is expected to be in Q3 2024 at 963,000 annualized units. Single-family starts are then forecast to rise to end 2025 at 1,009,000 annualized units and end 2026 at 1,065,000 annualized units.
Looking at full-year predictions, Fannie Mae now expects 10,000 more single-family starts in 2024 than forecast last month. Single-family starts in 2025 are forecast to be 994,000 units, down, 2,000 units from the level forecast last month. The initial forecast for full-year single-family starts in 2026 is for 1,044,000 units.
GDP growth outlook revised higher
The next chart, below, shows Fannie Mae’s current forecast for Gross Domestic Product (GDP) growth, along with other recent forecasts.
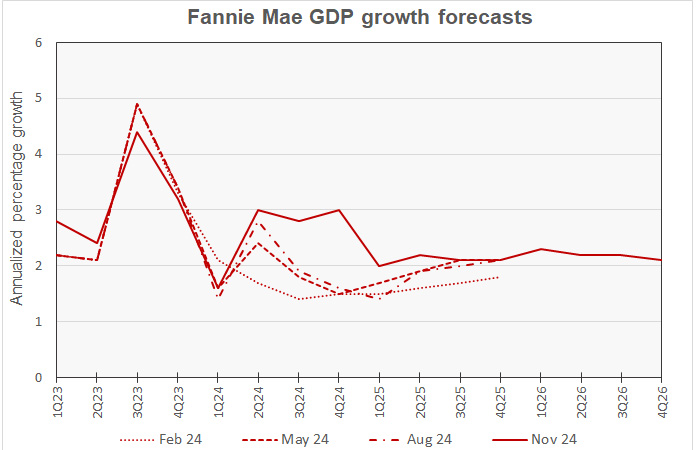
The forecast for Q3 2024 GDP growth was revised another 0.1 percentage point higher this month, reaching 2.8 percent at a seasonally adjusted annualized rate. It had been only 1.4 percent in July. The Q4 2024 forecast was again revised sharply higher, jumping 0.9 percentage points to 3.0 percent. It had been only 1.4 percent in September. The only other quarterly revision was for Q2 2025, where GDP growth was revised higher by 0.2 percentage points to 2.2 percent.
The low point in the annualized rate of GDP growth is now expected to be in Q1 and Q2 2025, with a rate of 2.2 percent. The annualized rate of GDP growth is predicted to reach 2.3 percent in Q1 2026 before falling back to 2.1 percent in Q4 2026.
The full year forecasts for GDP growth for 2024 and 2025 were each raised 0.1 percentage points to 2.4 percent and 2.1 percent respectively. The initial full-year GDP growth forecast for 2026 was 2.2 percent.
PCE Inflation forecasts mostly lower
The next chart, below, shows Fannie Mae’s current forecast for the chained personal consumption expenditures (PCE) inflation rate, along with three other recent forecasts.
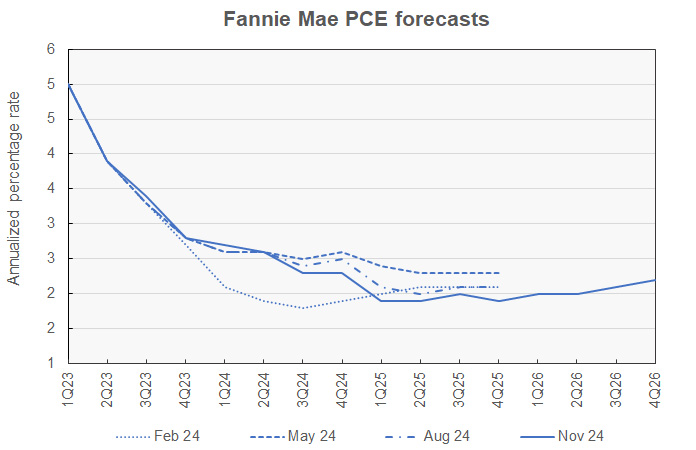
The largest revision to the inflation forecasts was a 0.3 percentage point downward revision to the forecast for Q4 2025. No other revision was larger than 0.1 percentage point. PCE inflation is forecast to hover around the Fed’s target of 2.0 percent through most of the forecast period, but it is predicted to rise to 2.2 percent year-over-year in Q4 2026.
Employment growth forecast slightly lower
The next chart, below, shows Fannie Mae’s current forecast for employment growth, along with three earlier forecasts. Employment growth is our preferred employment metric since job gains, along with productivity gains, drive economic growth. By contrast, the unemployment rate depends on employment but also on the labor force participation rate. Either rising employment or falling labor force participation can drive the unemployment rate lower, but only the former would contribute to economic growth.
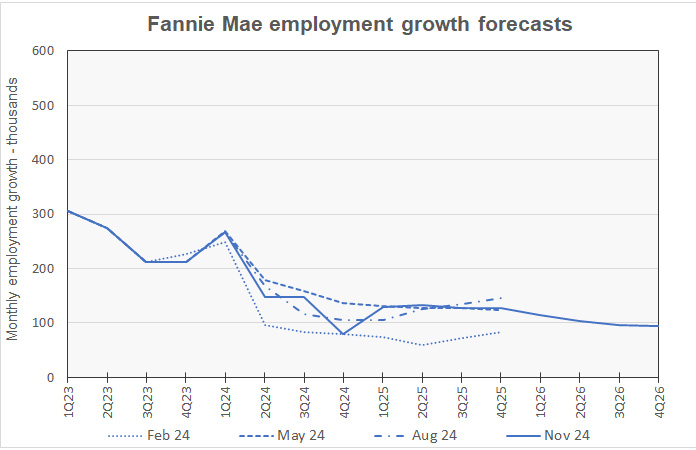
Most of the revisions to this month’s quarterly employment growth forecasts called for lower employment growth. However, small upward revisions were made to the predicted employment growth in Q2 and Q3 2025.
Monthly job growth is expected to be at its lowest in Q4 2024 but recover in 2025 before falling again through the end of 2026.
For reference, the business survey in the Employment Situation Report from the Bureau of Labor Statistics indicates that the economy added an average of 148,000 jobs per month in Q3 2024. The economy was reported to have added only 12,000 jobs in the first month of Q4.
Compared to last month’s forecast, the expected full year forecast for employment growth in 2024 was revised lower by 300,000 jobs while employment growth for 2025 was revised higher by 100,000 jobs. Employment growth in 2024 is expected to be 1,900,000 jobs. Employment growth in 2025 is expected to be 1,600,000 jobs. The initial employment growth forecast for 2026 called for the economy to add 1,200,000 jobs.
The Fannie Mae November forecast can be found here. There are links on that page to the detailed forecasts and to the monthly commentary.


