As in last month’s forecast, Fannie Mae’s January housing forecast calls for multifamily housing starts to bottom out in mid-2025 and then to steadily increase through the rest of the forecast horizon. However, their starts forecasts for every future quarter were revised lower, sometimes significantly so.
The forecast for single-family housing starts was revised marginally higher in Q1 2025 but lower in every subsequent quarter. Only very slow growth in single-family housing starts is expected through the end of 2026.
Wait and see
The forecast noted that, while the change of administration in Washington may be expected to introduce new policies which would affect the economic outlook, it is too soon to say what those policies may be. Therefore, no attempt has yet been made to adjust the forecast based on those potential changes.
Fannie Mae’s forecasters estimate that the Fed Funds rate averaged 4.7 percent in Q4 2024, up 0.1 percentage point from last month’s forecast. Fannie Mae’s forecasters expect the rate to fall to an average of 3.9 percent in Q4 2025 and then to stay at that level through the end of 2026. Last month’s forecast had called for the rate to continue to fall to 3.4 percent in Q4 2026.
Estimates for the 10-year Treasury rate were revised significantly higher this month. It is now predicted to have averaged a level of 4.3 percent in Q4 2024 and to go up from there. The rate is expected to rise to 4.6 percent in Q1 through Q3 2025. It rises again to 4.7 percent in Q4 2025 and remains there through the end of 2026. The rates predicted for 2025 and 2026 are 0.4 to 0.5 percentage points higher than those predicted in last month’s outlook.
The strength of the economy in terms of GDP growth and job creation in the face of the current high interest rates has caused some analysts to question how restrictive current interest rates are. Rates may need to stay high for longer in order to get inflation down to the Fed’s target.
Multifamily starts forecasts sharply lower
The current forecast for multifamily housing starts is shown in the first chart, below, along with three other recent forecasts. Fannie Mae considers any building containing more than one dwelling unit to be “multifamily”, including both condominiums and rental housing units.
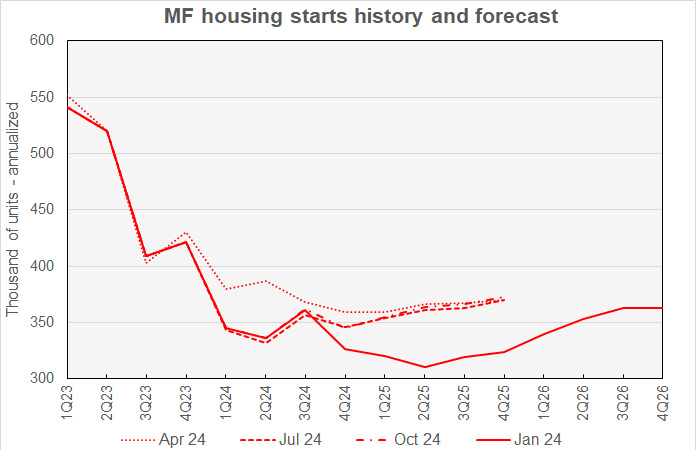
Revisions to Fannie Mae’s multifamily housing starts forecasts were significant and all to the down-side this month. The largest revision to last month’s forecasts was a 42,000 (annualized) unit decrease in the starts forecast for Q4 2026. This was a 10.4 percent drop from the level predicted last month. Fannie Mae’s forecasters have now revised their predicted number of starts for Q2 through Q4 of 2025 lower in every monthly forecast since last August’s.
The low point for multifamily starts is again seen as being in Q2 2025 but the minimum rate has been reduced 22,000 annualized starts to 310,000. The forecast calls for multifamily housing starts to rise from that point, ending with 363,000 annualized unit starts in Q4 2026.
For reference, the most recent new residential construction report from the Census Bureau has multifamily starts running at a seasonally-adjusted annualized rate of 376,000 units in Q4, although that rate may be revised in future reports. The Census Bureau also reports that there were 473,000 starts in 2023 and 355,000 starts in 2024.
Looking at yearly forecasts, the predicted number of multifamily starts for 2025 was revised lower by 19,000 units to 319,000 units. The forecast for multifamily starts in 2026 was revised lower by 35,000 units to 355,000 units.
Single-family starts forecast slightly lower
The current forecast for single-family housing starts is shown in the next chart, below, along with three other recent forecasts.
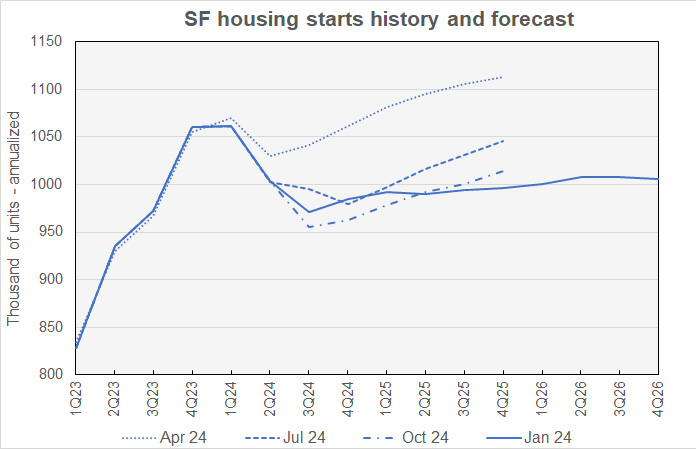
The Q1 2025 single-family starts forecast was the only forward-looking forecast that was revised higher, adding 5,000 annualized units. The forecasts for every other quarter of 2025 and for every quarter of 2026 were revised lower. However, the largest reduction in forecast starts for any quarter was only 8,000 annualized units.
Once again, the low point for single-family starts is said to have been in Q3 2024 at 971,000 annualized units. Single-family starts are then forecast to rise to 996,000 units at the end of 2025 and to end 2026 at 1,006,000 annualized units, down 7,000 units from last month’s forecast.
Looking at full-year predictions, Fannie Mae now expects 1,000 fewer single-family starts in 2025 than forecast last month at 993,000 units. The forecast for full-year single-family starts in 2026 is for 1,005,000 units, down 7,000 units from last month’s forecast.
GDP growth forecasts generally lower
The next chart, below, shows Fannie Mae’s current forecast for Gross Domestic Product (GDP) growth, along with other recent forecasts.
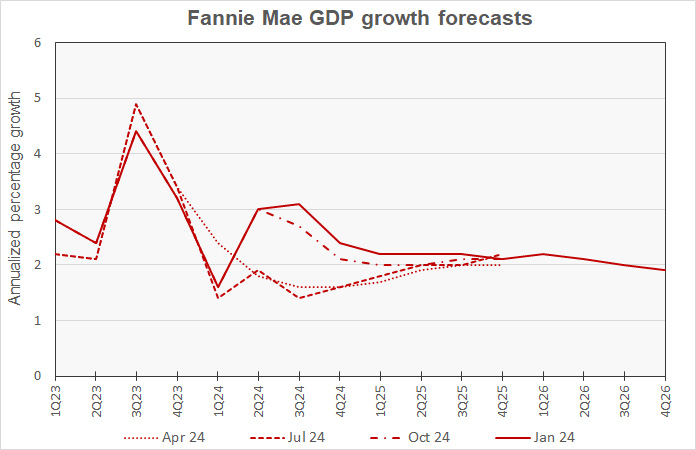
A surprising thing about Fannie Mae’s latest GDP forecast is that the largest revision was made to the GDP growth rate for a quarter in the past. The Q3 2024 GDP growth estimate was revised 0.3 percentage points higher to 3.1 percent. No other quarterly forecast revision was greater than 0.1 percent and most quarters were not revised at all.
Fannie Mae’s forecasters expect GDP growth to be 2.2 percent in the first part of 2025, fading to only 1.9 percent by Q4 2026.
The full year forecasts for GDP growth for 2024 and 2025 were raised t0.1 percentage point to 2.5 percent and 2.2 percent respectively. The full-year GDP growth forecast for 2026 was lowered 0.1 percentage point to 2.0 percent.
PCE Inflation forecast revisions generally higher
The next chart, below, shows Fannie Mae’s current forecast for the chained personal consumption expenditures (PCE) inflation rate, along with three other recent forecasts.
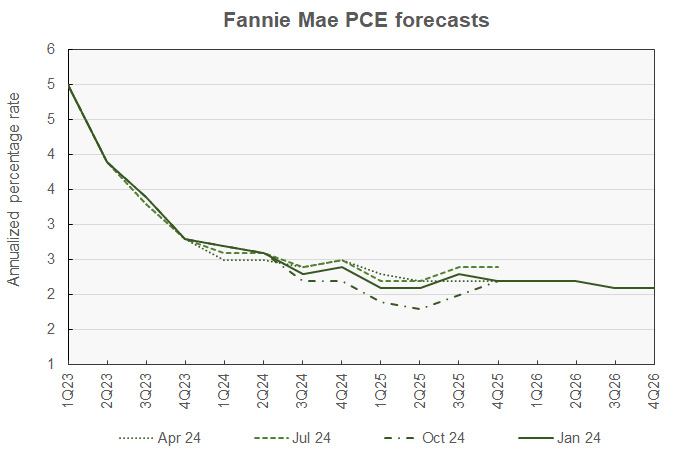
Fannie Mae’s forecasters see inflation falling more slowly than they did last month. They revised their forecasts for PCE inflation in Q3 and Q4 2025 each higher by 0.2 percentage points to 2.3 percent and 2.2 percent respectively. They revised their forecasts for PCE inflation in Q2 2025 and in Q1 and Q2 2026 each higher by 0.1 percentage points. PCE inflation in Q4 2026 is now predicted to be lower by 0.1 percentage point at 2.1.
Employment growth forecast higher in 2025 and lower in 2026
The next chart, below, shows Fannie Mae’s current forecast for employment growth, along with three earlier forecasts. Employment growth is our preferred employment metric since job gains, along with productivity gains, drive economic growth. By contrast, the unemployment rate depends on employment but also on the labor force participation rate. Either rising employment or falling labor force participation can drive the unemployment rate lower, but only the former would contribute to economic growth.
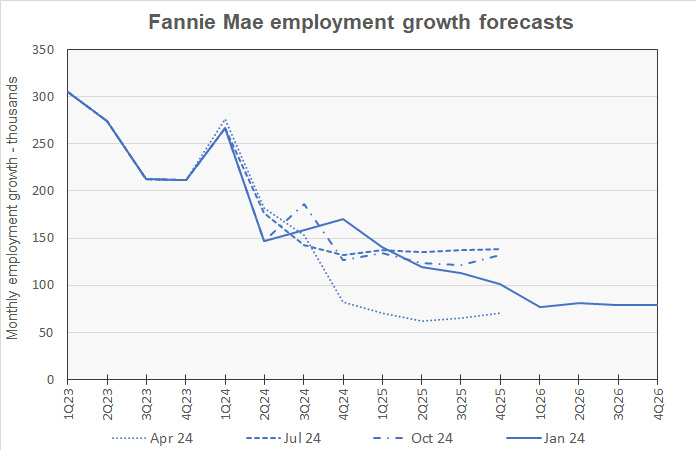
The revisions to this month’s quarterly employment growth forecasts see stronger growth in the near-term followed by weaker growth in the long-term. Employment growth forecasts for Q4 2024 through Q3 2025 were revised higher by between 11,000 jobs per month and 45,000 jobs per month. Quarterly jobs growth forecasts for 2026 were revised lower by between 6,000 and 14,000 jobs per month.
The forecasters called for monthly employment growth in Q4 2024 to be 170,000 jobs per month. Employment growth is then predicted to decline quarter-by-quarter, reaching only 79,000 jobs per month in Q4 2026.
For reference, the business survey in the January Employment Situation Report from the Bureau of Labor Statistics indicates that the economy added an average of 170,000 jobs per month in Q4 after a big uptick in December employment growth.
Compared to last month’s forecast, the expected full year forecasts for employment growth in 2024 and 2025 were revised higher by 100,000 jobs while employment growth for 2026 was revised lower by 200,000 jobs. Employment growth in 2024 is expected to be 2,200,000 jobs. Employment growth in 2025 is expected to be 1,400,000 jobs. The employment growth forecast for 2026 called for the economy to add 900,000 jobs.
The Fannie Mae January forecast can be found here. There are links on that page to the detailed forecasts and to the monthly commentary.


