Senior housing demand is increasing as occupancy reaches new highs, but supply remains stagnant, according to the National Investment Center for Seniors Housing & Care (NIC).
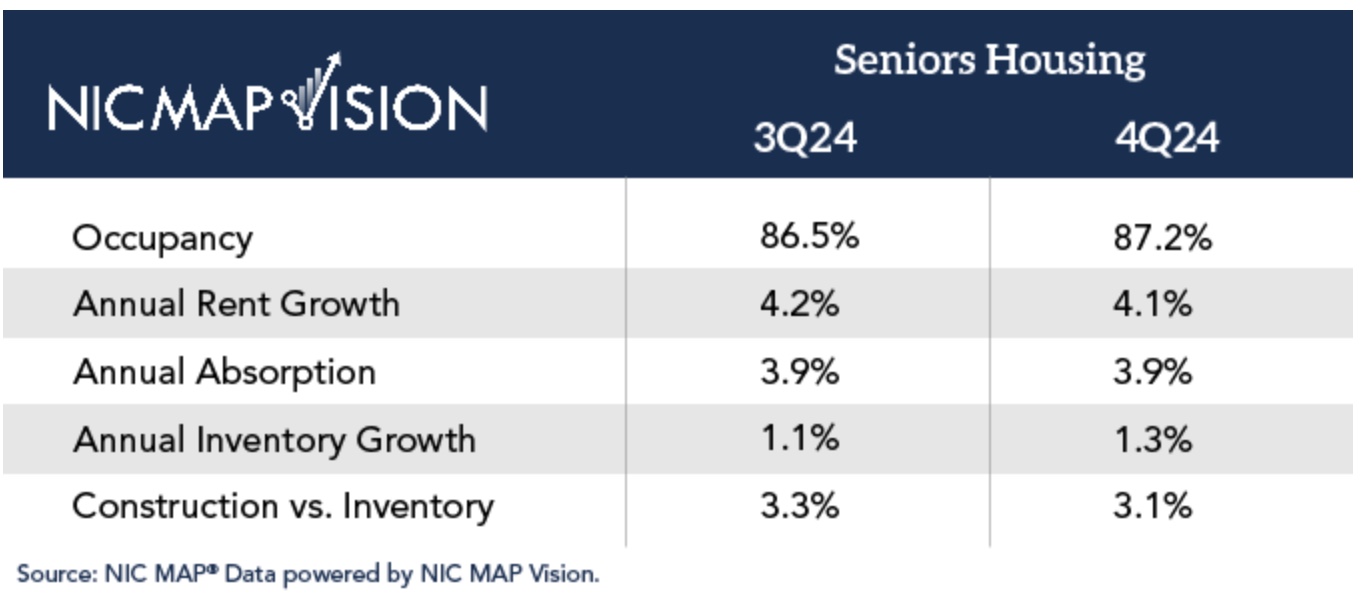
The national occupancy rate for senior housing properties increased to 87.2 percent in Q4 2024 from 86.5 percent in the third quarter. NIC expects occupancy to break 90 percent by 2026, with some markets reaching levels in the mid-90 percent range as a record number of older adults turn to senior housing.
The three markets with the highest and lowest occupancy rates remained unchanged from previous quarters. Boston at 91.0 percent, Baltimore at 89.9 percent, and Tampa at 89.8 percent had the highest occupancy rates of NIC’s 31 primary markets. Atlanta at 83.9 percent, Houston at 83.5 percent, and Las Vegas at 82.9 percent recorded the lowest.
Although occupancy in senior housing properties has recovered from post-pandemic doldrums, supply continues to lag because construction has stalled, say NIC experts. Less than 22,000 senior housing units were under construction in Q4 2024, the lowest level since the first quarter of 2014, while less than 8,800 senior housing units were added last year across all primary markets, slightly more than the total added the previous year.
Despite increased demand, growth in new senior housing options is at one of its lowest levels in recent history, says NIC, which expects inventory to increase by only 4.1 percent through 2026, well short of demand. Meanwhile, 44 percent of the nation’s senior housing stock is more than 25 years old and in need of renovations.
Why is supply not keeping pace with demand? One reason, says NIC, is that it takes 75 percent of all properties nearly three years to go from groundbreaking to completion, due in part to lengthy permitting and approval processes.
Another reason is that construction lenders continue to be cautious of the senior housing space. While permanent loan volume increased by more than 100 percent since the first quarter of 2024, its highest level since 2020, a lack of construction financing continues as a barrier to industry growth.
Loan volume for new construction improved slightly by the end of 2024 but remained well below historical standards, with the number of senior housing units under construction near its lowest level since 2015.
“New construction deals are difficult to pencil today because of the volatility of the cost of capital, changes in what the consumer is willing to pay, and skyrocketing development costs,” said NIC CEO Arick Morton. “First and foremost, we need to see meaningful improvement in the access to capital for new construction before we will see the needle move on development activity, which is sorely needed to meet the growing demand.”
The chart below shows senior housing fundamentals in Q3 and Q4 of 2024.

The current imbalance between high demand and limited new supply is expected to benefit existing senior housing providers, and most analysts forecast increasing occupancy rates and strong financial performance in 2025.
But staffing shortages remain a significant concern for the industry, since immigrants make up 25.7 percent of the long-term care workforce, including senior housing, according to a study by McKnight’s Senior Living.
For now, senior housing leaders are taking a wait-and-see approach to the Trump administration’s focus on immigration, while the American Seniors Housing Association continues to advocate for immigration legislation that creates a visa category for caregivers and other front-line workers who are critical to meeting the demand for senior housing services.
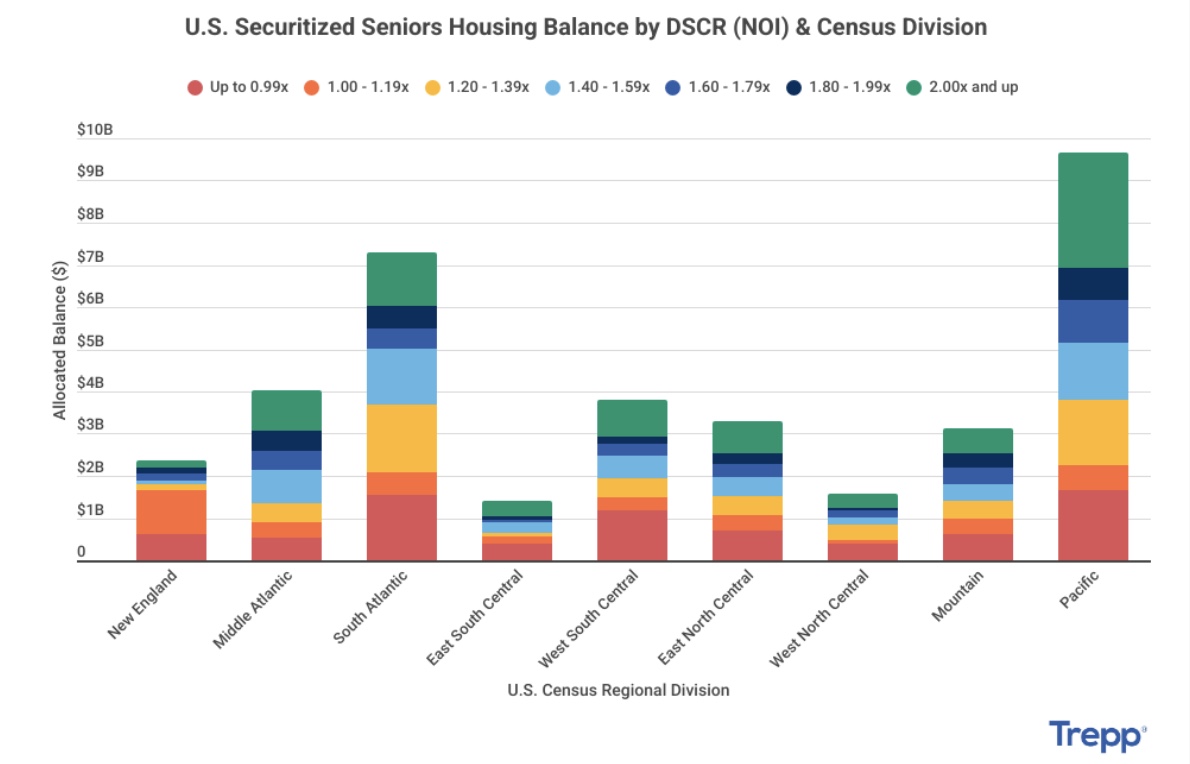
Meanwhile, the U.S. currently has nearly $36.6 billion of senior housing debt, seen by market participants as an opportunity to gain exposure to an industry that caters to the growing baby boom demographic, according to CRE data and analyst Trepp in its CRE Rundown.
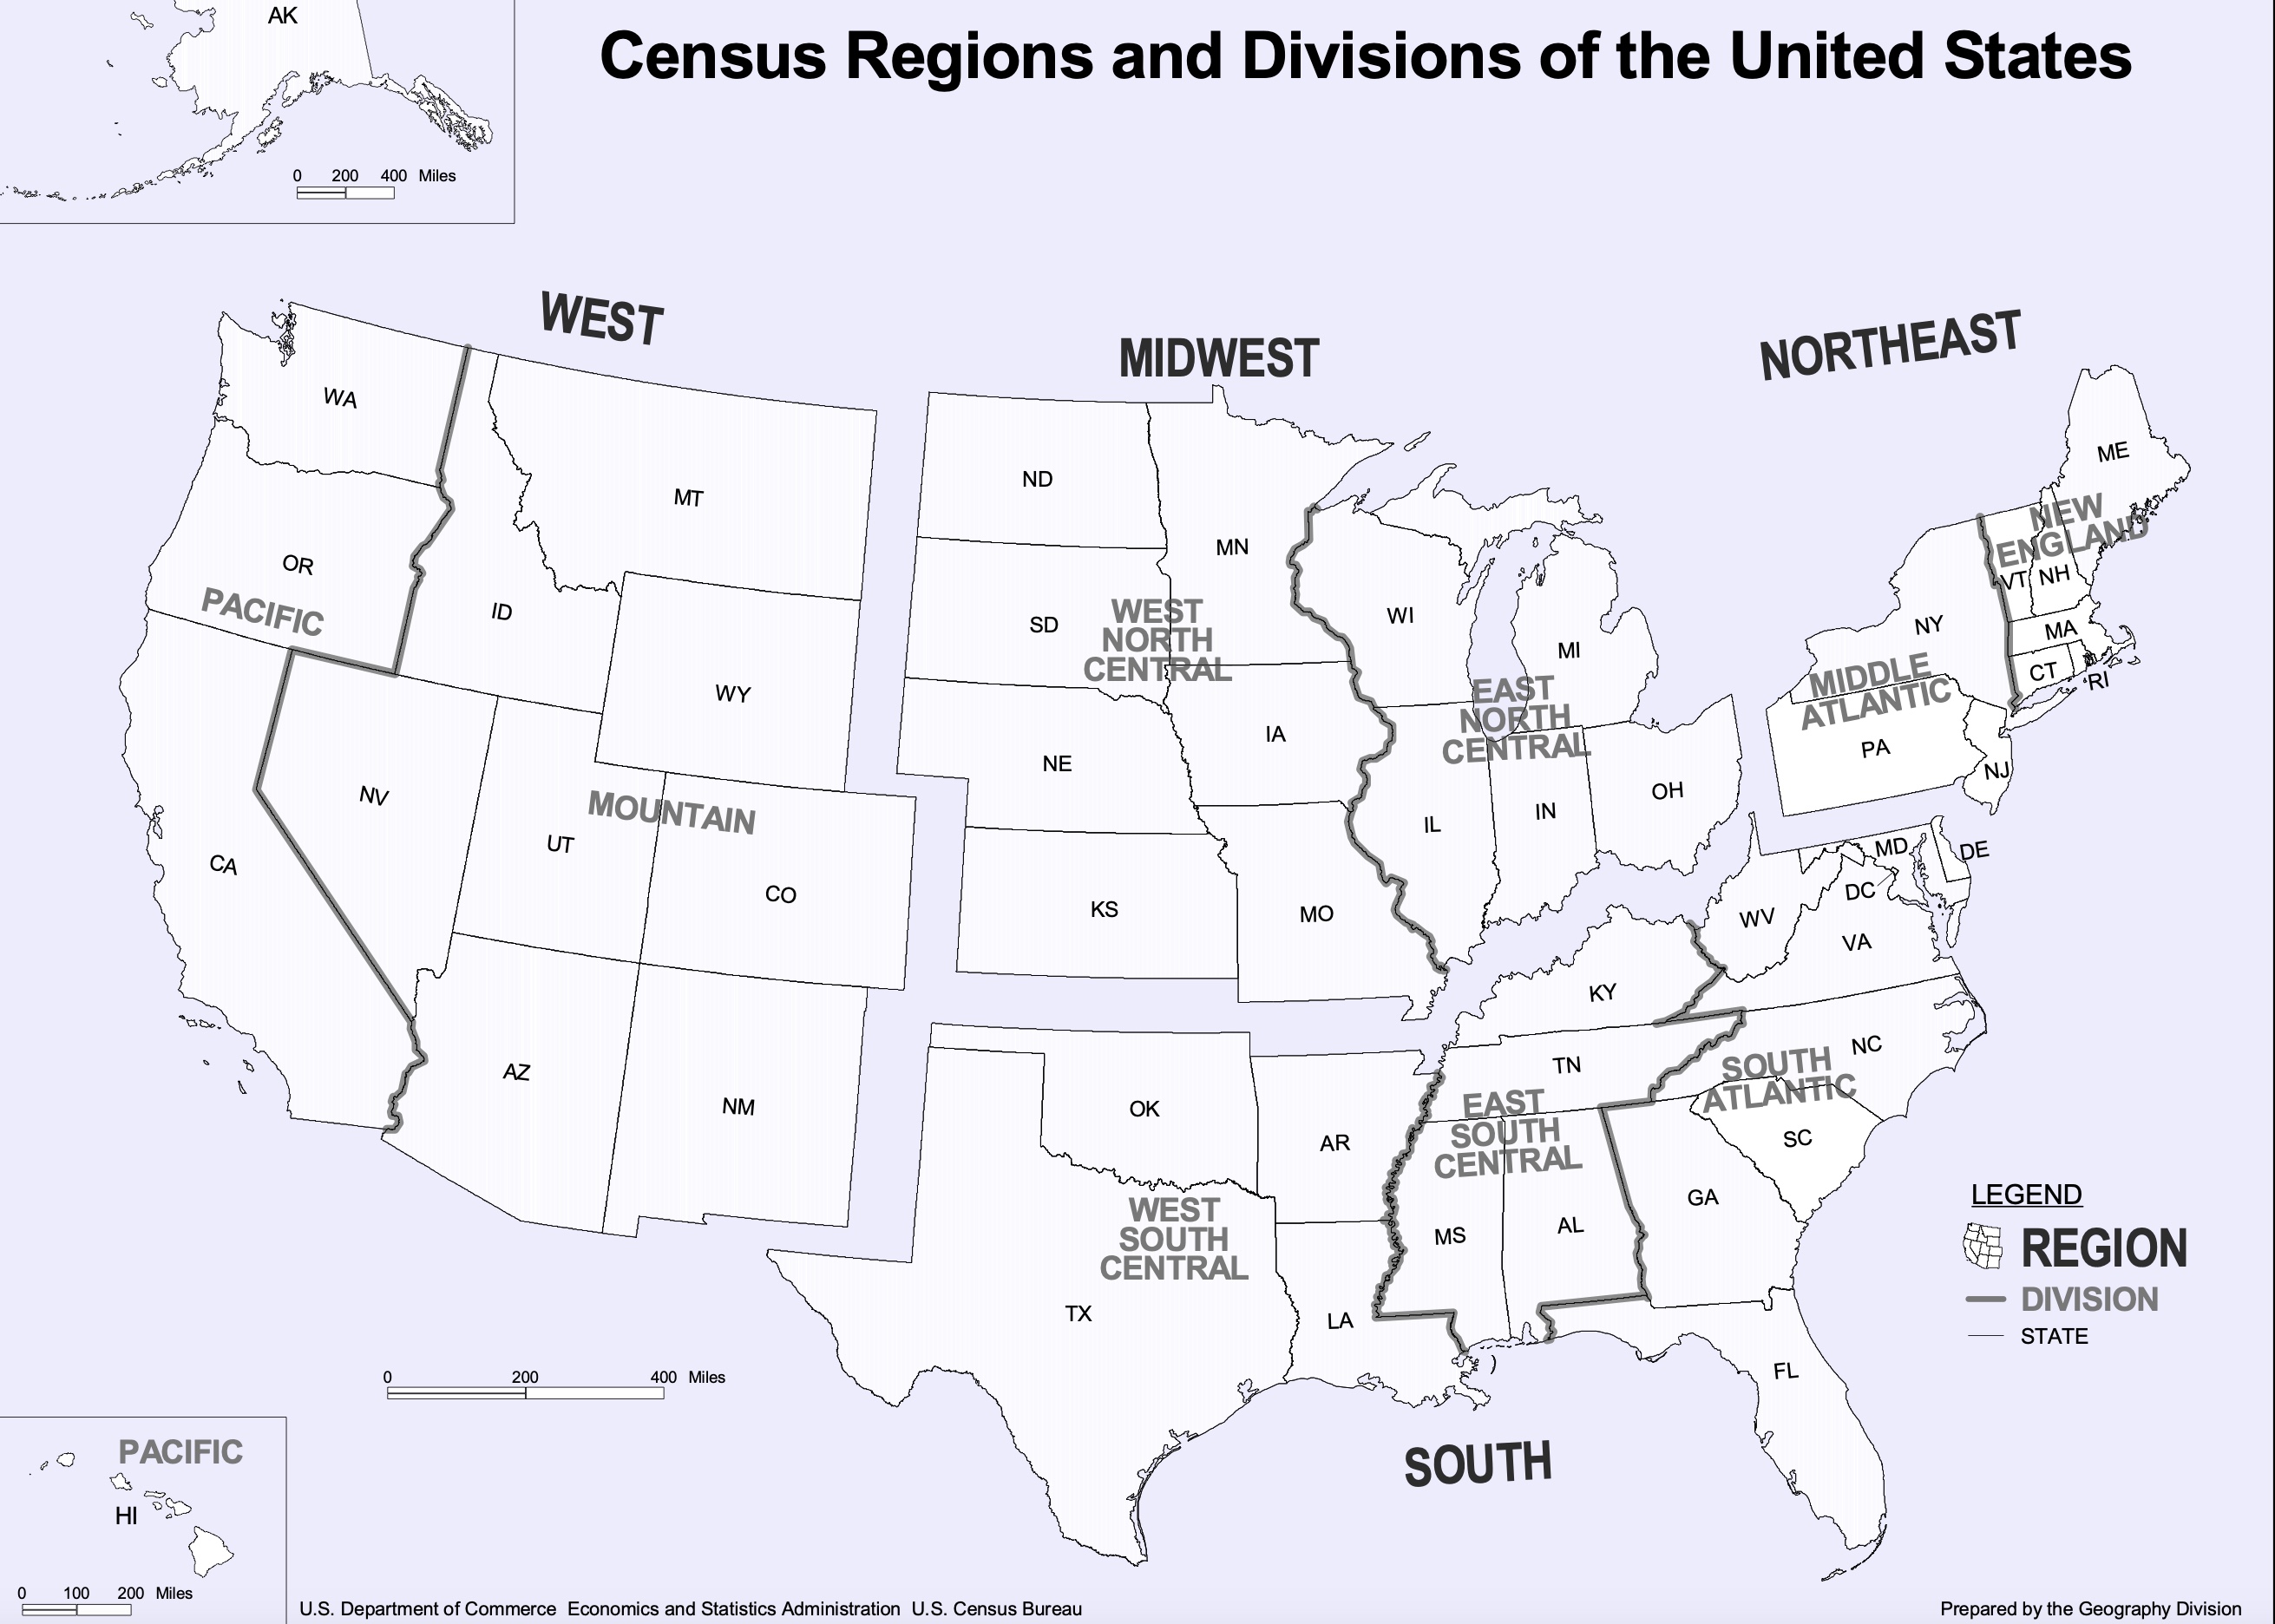
 The outstanding senior housing debt is stratified in Trepp’s chart above by debt-service coverage ratio against net operating income in the U.S. Census Bureau’s nine regional divisions, seen below.

Trepp’s chart reveals that the top regional concentrations of 26.44 percent are in the Pacific followed by 19.98 percent in the South Atlantic and 10.99 percent in the Middle Atlantic.
The West South Central (30.96 percent) leads the way in concentration by balance with a DSCR less than 1.0x, followed by East South Central (27.59 percent percent) and New England (26.58 percent).


