

The Employment Situation Report from the Bureau of Labor Statistics (BLS) stated that the economy experienced modest overall employment growth in January. While the employment levels for 3 of the 4 multifamily-related job categories we track were reported to be higher than the revised levels reported for last month, adjustments to the BLS’s underlying assumptions make comparisons to earlier employment reports difficult.
As usual for the January report, the Bureau of Labor Statistics made revisions to their population figures based on the latest estimates from the Census Bureau. The adjustments increased the size of the US population by 2,871,000, the size of the civilian labor force by 2,106,000, the number of employed people by 2,000,000, and the number of unemployed people by 105,000. These updates primarily affect the household survey, which is used to determine the unemployment rate. However, large revisions were also seen in the business survey data, which is used to determine employment levels by occupation. Oddly, most of these latter revisions lowered reported employment levels.
Overall employment up, sort of
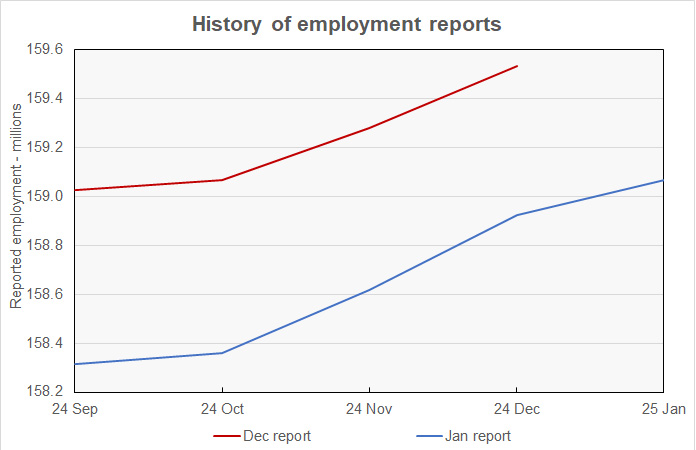
The BLS reported that total seasonally adjusted non-farm employment increased by 143,000 jobs to 159,069,000 jobs in January, based on their survey of business establishments. However, with the major revisions in this month’s report, last month’s employment level was revised lower by 610,000 jobs, so overall employment is lower than what was reported last month despite the reported gain.
The employment levels for recent months as given in the last two employment reports are illustrated in the first chart, below, based on the survey of business establishments. The revisions in this month’s report resulted in lower reported employment levels throughout 2024. They also resulted in a lower total employment gain for the year. Earlier data had indicated that the economy added 1,976,000 jobs in 2024. Revised data put the total employment gain at 1,877,000 jobs.
The BLS household survey reported that the US unemployment rate fell slightly to 4.0 percent. The household survey found that the number of employed persons was 163,895,000. The number of unemployed persons was 6,849,000.
The household survey also found that the number of people in the civilian labor force was 170,744,000. The labor force participation rate rose to 62.62 percent. It had been at 63.33 percent before the pandemic. Recovering that 0.71 percent decline in the labor force participation rate would bring 1.94 million more people into the workforce.
Focusing on multifamily employment
The BLS reported more detailed employment information on four job categories of interest to the multifamily industry. These are employment as residential construction workers, as specialty trades within residential construction, as residential property managers and as lessors of residential buildings. As usual, some of the data was reported with a one month delay, so the latest figures for the latter two categories are for the month of December.
Residential construction employment flat overall
The next chart shows the history of the levels of employment since 2015 in the two construction jobs categories we track.
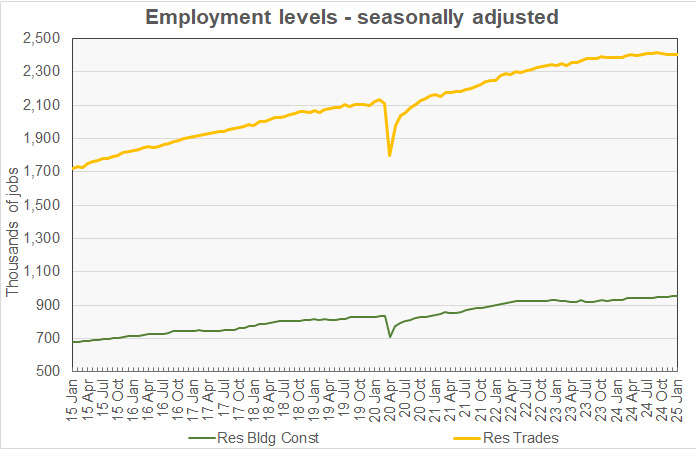
Employment in residential building construction in January, usually with general contractors, was reported to be up by 1,900 jobs. However, the prior month’s employment level was revised lower by 6,400 jobs so reported employment in this category is 4,500 jobs lower than the preliminary value reported last month. Employment in this category is now 956,000 jobs, up 2.7 percent year-over-year.
Employment in residential building trades, i.e. plumbers, electricians, etc., in January was reported to be down by 2,100 jobs from last month’s level. In addition, the December jobs figure was revised lower by 13,000 jobs so employment in this category is 15,100 jobs lower than the level reported last month. Employment in residential building trades is now 2,403,000 jobs, up 0.6 percent year-over-year.
Total January employment in these two categories of residential construction jobs combined is down 0.01 percent from the revised level of the month before but up 1.2 percent year-over-year.
Property management jobs up before revisions
The next chart shows the history of the levels of employment since 2015 in the two property management jobs categories we track.
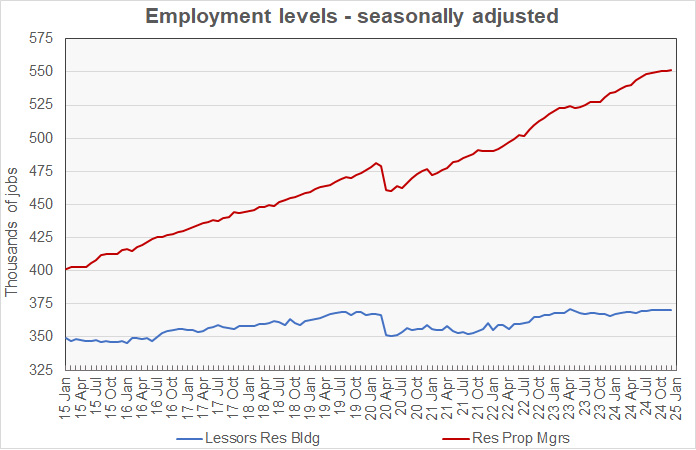
Employment for residential property managers in December was reported to be up by 900 jobs from its revised (-7,200 jobs) level for November to 551,800 jobs. Employment in this category is up 3.3 percent year-over-year.
Employment for lessors of residential buildings in December was reported to be up 300 jobs from the revised (-7,900 jobs) level for November at 370,400 jobs. Employment in this category is up 1.2 percent year-over-year.
Total employment in these two categories of apartment operations jobs combined was reported to be up 0.13 percent from the revised level for last month and up 2.5 percent year-over-year.
Illustrating relative trends
The final chart, below, presents the employment data in a different format. It normalizes the employment levels in each of the four jobs categories to a reading of 100 for January 2015. It also provides trend lines for the growth in each of the categories of employment based on the period from January 2015 through February 2020.
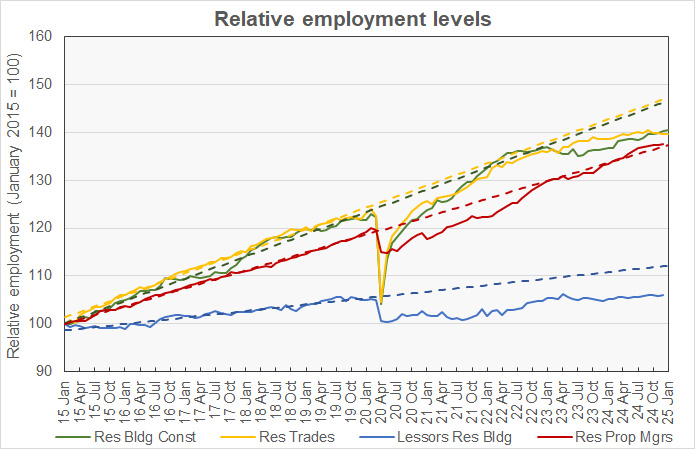
Residential building construction employment is now 4.1 percent below trend. Residential trades employment is now 5.3 percent below trend. Residential property managers employment is 0.4 percent above trend and lessors of residential buildings employment is now 5.4 percent below trend.
The numbers given in the Employment Situation report are seasonally adjusted and are subject to revision. It is common for small adjustments to be made in subsequent reports, particularly to the data for the most recent month. The current Employment Situation report can be found here.


