

Trepp reported that special servicing rate for multifamily commercial mortgage-backed securities (CMBS) loans fell slightly in January, declining by 30 basis points. It had risen for 5 months in a row. The overall CMBS special servicing rate on commercial property declined slightly.
Multifamily CMBS special servicing rates fall
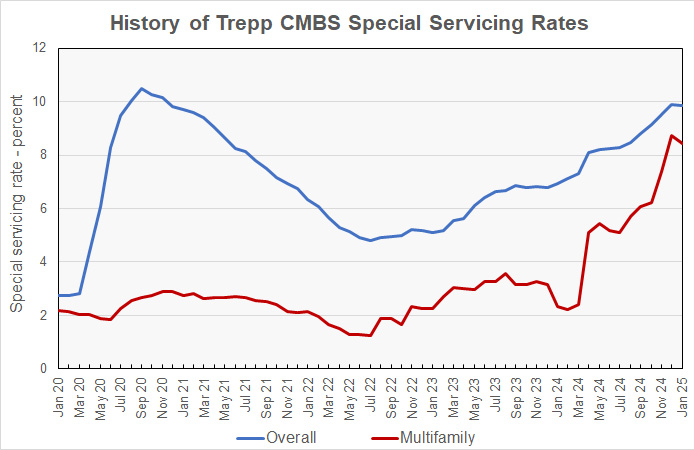
After climbing by 261 basis points in just the past two months, the special servicing rates on CMBS loans on multifamily property fell to 8.42 percent in January. It was 2.34 percent one year ago.
The report found that overall CMBS special servicing rate fell to 9.87 percent, down from 9.89 percent the month before. This rate has been trending higher since July 2022 when it was 4.79 percent.
The special servicing rate on mixed-use properties took the largest jump again this month, climbing another 94 basis points after last month’s 181 basis point rise. The special servicing rate reached 12.71 percent.
The special servicing rate on CMBS loans on industrial properties had been hovering around 0.40 percent for the last two years. However, in the last two months, it has risen by 28 basis point, reaching a level of 0.66 percent, a multi-year high.
The rate on lodging properties fell 13 basis points to 8.17 percent.
The special servicing rate on office properties climbed 33 basis points to 15.11 percent. This is the highest this rate has been since Trepp began tracking it in 2000.
The rate for retail properties had by far the largest decline this month. It fell 131 basis points to 10.68 percent.
The history of the overall and multifamily CMBS special servicing rates as reported by Trepp since January 2020 is illustrated in the chart, below.
The full Trepp special servicing rate report can be found here.
Average loan loss rises as volume surges
Trepp’s report on the volume and severity of loan losses on CMBS loans which were resolved in January showed a slight decline in the number of loans disposed but a big increase in the total loan disposed amount and in the losses incurred.
The report indicated that, of the 14 loans that were resolved for a loss in the month, none of them was exclusively on multifamily property. However, one was on a mixed use property and one was on a portfolio with a variety of asset types.
The history of the average losses incurred and the loss severity over the last 25 months is shown in the next chart, which shows the average loss incurred per resolved loan along with the average percentage of a resolved loan’s value that was lost during resolution.
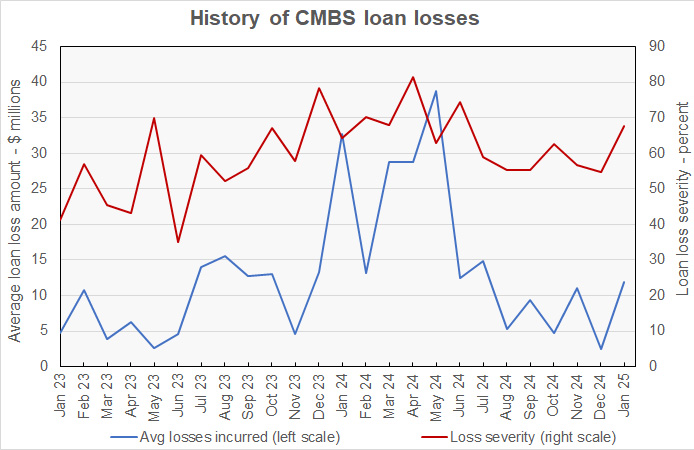
The chart shows that the severity of CMBS loan losses jumped in January, rising almost 13 percentage points to 67.63 percent. The average dollar loss per loan also surged, rising to $11.9 million. While this is much higher than last month’s average of $2.5 million, it is in line with the average CMBS loan loss severity over the last 12 months.
The number of loans resolving in January fell from 16 to 14. The total dollar value of the loans that resolved rose to $246.9 million, nearly 3 ½ time last month’s level and well above the 12-month average of $175.1 million.
Since monthly loan loss data can be volatile, Trepp also reports on the 12-month trailing average loss severity for loans with losses of greater than 2 percent. This figure edged higher to 65.13 percent this month, up from 64.67 percent last month. A year ago, it was 64.21 percent. The January loan loss severity report can be found here.


