

The producer price index (PPI) report from the Bureau of Labor Statistics (BLS) stated that construction materials prices rose 0.3 percent month-over-month in January on a seasonally adjusted basis. The index of components and materials for construction was up 1.1 percent from its year-earlier level.
Overall prices for processed goods for intermediate demand were up 1.0 percent for the month. All of the components of this index rose, with the prices of processed fuels and lubricants up 3.5 percent. The overall processed goods for intermediate demand index was 1.0 percent higher than its year-earlier level.
For reference, the changes in these indexes compare with a 0.5 percent month-over-month rise and a 3.0 percent year-over-year rise in the all-items consumer price index (CPI-U) in January.
Yield Pro compiled the BLS reported changes for our standard list of construction materials prices. These are prices of materials which directly impact the cost of constructing an apartment building. The first two right hand columns of the table provide the percent change in the price of the commodity and the percent change in price from December (1 Mo PC Change) and from a year earlier (12 Mo PC Change). If no price data is available for a given commodity, the change is listed as N/A.
The pre-COVID column lists the change in the current construction materials prices relative to the average of prices from January 2019 through February 2020, before the pandemic impacted the economy. This provides a longer-term view of construction materials price trends.
| Commodity | 1 Mo PC Change | 12 Mo PC Change | Pre-covid Change |
| Softwood lumber | (1.8) | 9.5 | 19.9 |
| Hardwood lumber | 1.0 | 3.8 | 33.4 |
| General millworks | 0.0 | 2.4 | 31.5 |
| Soft plywood products | (0.5) | (11.8) | 58.7 |
| Hot rolled steel bars, plates and structural shapes | 10.9 | 2.8 | 55.1 |
| Copper wire and cable | 0.7 | 7.9 | 40.1 |
| Power wire and cable | (0.9) | 0.3 | 128.3 |
| Builder’s hardware | 0.0 | 1.8 | 24.8 |
| Plumbing fixtures and fittings | 1.5 | 2.0 | 21.6 |
| Furnaces and heaters | 0.0 | 0.2 | 37.2 |
| Sheet metal products | 0.3 | 0.4 | 46.9 |
| Electrical Lighting fixtures | 0.0 | 4.1 | 22.5 |
| Nails | (0.3) | (4.3) | 18.0 |
| Major appliances | 0.4 | (1.3) | 21.2 |
| Flat glass | 2.0 | 6.7 | 37.1 |
| Ready mix concrete | 1.6 | 4.1 | 39.4 |
| Asphalt roofing and siding | (0.2) | 1.7 | 42.4 |
| Gypsum products | (0.1) | 5.5 | 48.5 |
| Mineral wool insulation | 0.5 | 7.3 | 50.9 |
| CPI-U (unadjusted) | 0.7 | 3.0 | 23.2 |
The prices used by the BLS in compiling the indexes are collected on the Tuesday of the week containing the 13th day of the month. In January that would have been January 14. In the February report, the data collection date will be February 11.
The first chart, below, shows the price index history for wood products over the past 37 months.
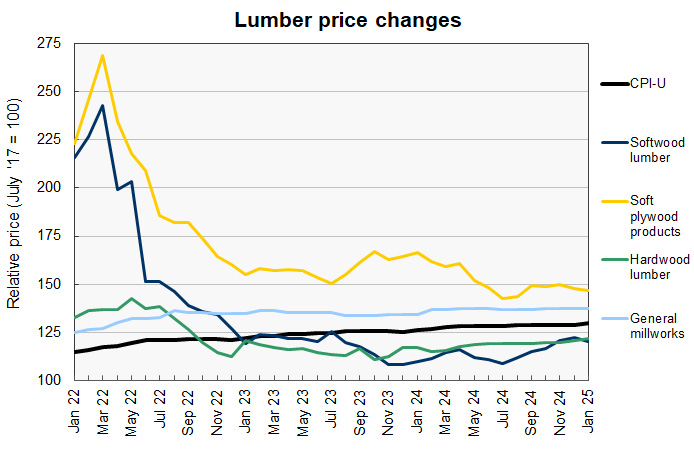
After rising steadily since July, softwood lumber prices took a step back in January. The 1.8 percent decline for the month was the largest of the construction materials prices that we track. However, its price gain over the last 12 months is the largest of the construction materials prices that we track. Unfortunately, lumber’s price rise resumed in February, with the price on February 11 closing 5.8 percent higher than it did January 14th.
Soft plywood prices dropped again this month. In addition, last month’s soft plywood price index was revised lower by 1.1 percent.
The next chart, below, shows the recent history of several other construction materials prices. These are relatively simple commodities whose prices are strongly driven by those of the materials of which they are comprised.
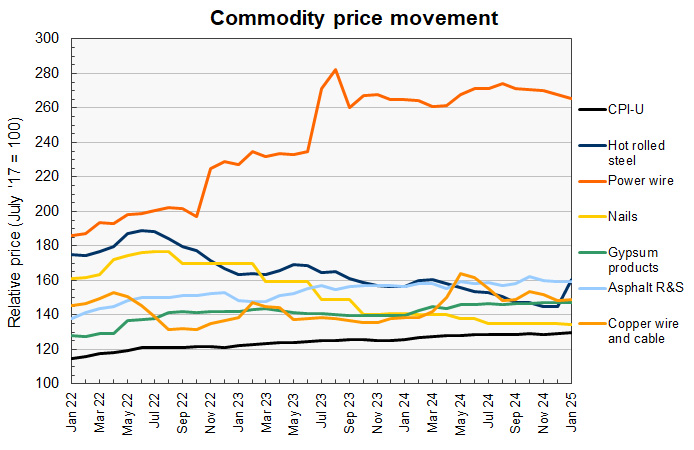
The prior month’s price index for hot rolled steel bars again had the largest revision in this month’s report. However, while the prior month’s index was revised higher in last month’s report, it was revised lower this month. It was reported to be 2.5 percent lower than originally stated in last month’s report. The price index for hot-rolled steel bars has risen 11.2 percent in just that last two months.
The price index for copper wire was up 0.7 percent in January, the only construction materials price illustrated in the above chart other than steel bars that rose for the month.
Price changes for several of the more finished goods from our sample are illustrated in the final chart, below.
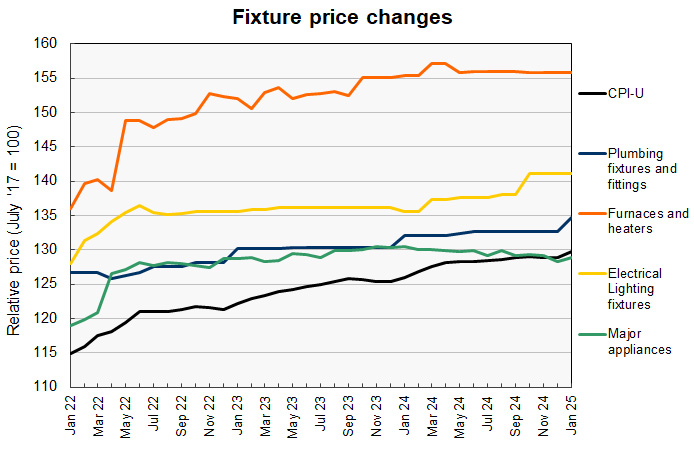
While the price index for electrical lighting fixtures was reported to be unchanged for the month, the indexes for the last 3 months were each revised higher by 2.2 percent. These were the largest upward revisions for the construction materials prices that we track.
After being unchanged for 7 months, the price index for plumbing fixtures and fittings moved higher this month with the third largest rises of the prices we track.
Last month, the index for major appliances dropped 1.6 percent. This month, between the reported rise and the upward revision to last month’s price index value, it was up 1.6 percent.
The full current BLS report can be found here.


