

CoStar reported that its value-weighted index of multifamily property prices fell 0.8 percent month-over-month in January, a setback after four months of reported increases. This index was down 0.9 percent year-over-year.
By contrast, MSCI Real Capital Analytics reported that multifamily property prices were up 0.7 percent for the month but down 1.6 percent year-over-year in January.
The value-weighted index of non-multifamily commercial property fell 0.2 percent month-over-month in January. This index is down 2.1 percent year-over-year. The other commercial property types tracked by CoStar are office, retail, industrial and hospitality.
For more information on the CoStar Commercial Repeat Sales Indexes (CCRSI’s), please see the description at the bottom of this report.
Multifamily property prices in upward trend
The first chart, below, shows the history of the value-weighted CCRSI’s since January 2016 for multifamily property and for all other commercial property considered as a single asset class. It also shows trend lines for the growth in the two CCRSI’s based on their growth in the period from January 2012 to January 2020. The indexes are normalized so that their values in December 2000 are set to 100.
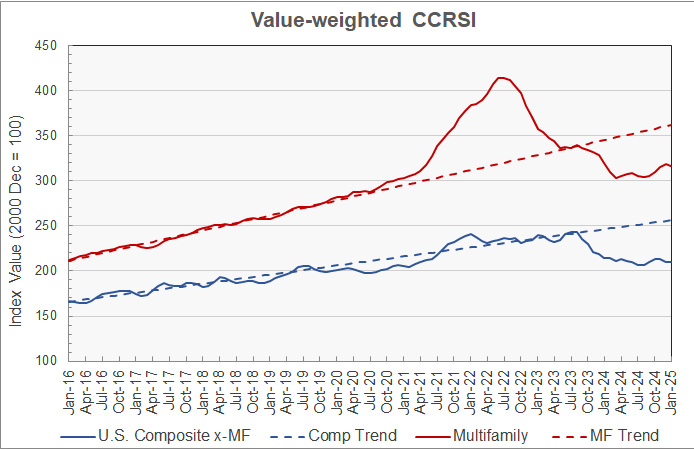
The chart shows that multifamily property prices have been trending higher since reaching a recent low in March. While their rise has not been uniform, multifamily property prices are up 4.6 percent since then. Currently, multifamily property prices are down 23.5 percent from the high they reached in July 2022. They are 12.5 percent below their pre-pandemic trend.
Prices for other commercial property types fell again this month, extending their losing streak to three months. These prices are now 13.8 percent below their high point and 18.3 percent below their pre-pandemic trend.
Transaction volume reverse last month’s surge
An issue with monthly transaction volume reporting is that CoStar usually identifies additional transactions to tabulate over the next few months after the initial report, and these extra transactions tend to make initial reports of rising transaction volumes appear less positive than they will subsequently appear. For example, CoStar reported that the transaction volume in January for all property types was down 729 transactions (36.5 percent) from the revised level of the month before, but it was down only 25.9 percent from the preliminary level for December reported last month.
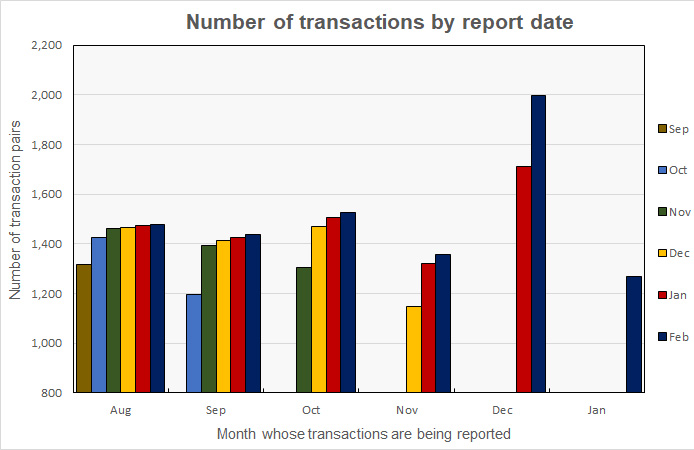
CoStar reported that their initial transaction count for January was 1,267 repeat sales pairs. This is down from the 1,710 transaction pairs identified for December in last month’s report and down from the 1,996 transaction pairs identified for December in this month’s report.
The history of the revisions to the transaction counts for recent months is illustrated in the next chart. It shows that the number of transactions for August was initially given as 1,315 in the September report and has been revised higher in every subsequent report. While the size of the transaction count revision was largest in the next month’s report, additional transaction pairs for August continued to be identified in every subsequent report. The current report identifies 1,479 transactions for August. By contrast, transaction data for January only appears in the current (February) report and we can expect it to be revised next month.
The preliminary dollar volume of transactions was reported to fall 42.8 percent from the revised level of the month before to $9.06 billion. The dollar volume of transactions fell 36.9 percent from the preliminary level reported last month.
Distress eases
CoStar also reported on the portion of sales that would be considered “distressed”. The next chart shows the distressed sales trends for investment grade and commercial grade property sales. Because of volatility in the data, it presents the 3-month weighted moving average of CoStar’s distressed sales data.
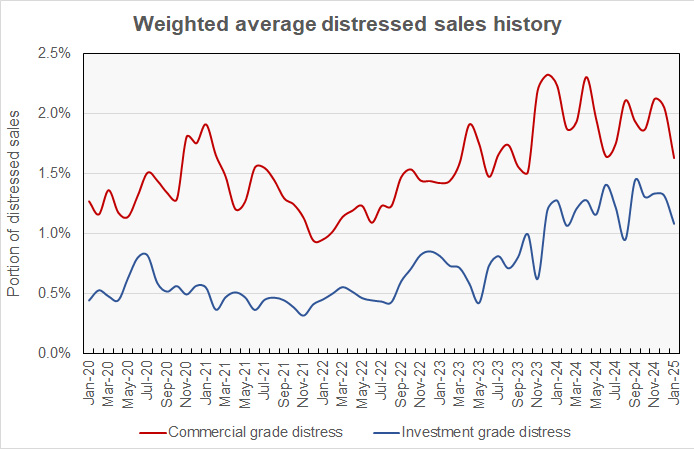
The chart shows that the portion of sales that CoStar designates as distressed has been trending higher since late 2021. However, the data is so volatile that even the averaged data shows large month-to-month variations. This month’s data shows a decline in the portion of distressed sales. However, similar drops have been seen during the recent rising trend, so we will have to see if this month’s drop signals a change in the trend.
The full report discusses all commercial property types. While the CoStar report provides information on transaction volumes, it does not break out multifamily transactions. The latest CoStar report can be found here.
CCRSI defined
The CoStar report focuses on a relative measure of property prices called the CoStar Commercial Repeat Sales Index (CCRSI). The index is computed based on the resale of properties whose earlier sales prices and sales dates are known. The index represents the relative change in the price of property over time rather than its absolute price. CoStar identified 1,267 repeat sale pairs in January for all property types. These sales pairs were used to calculate the results quoted here.
CoStar computes CCRSI’s for a variety of property groupings, combining them by cost, region, property type or other factors. The value-weighted index is more heavily influenced by transactions of expensive properties than is CoStar’s equal-weighted index. The value-weighted index is the focus of this report because it is an index whose value is reported monthly and for which CoStar breaks out multifamily property as a separate category.


