

A recent report from the Mortgage Bankers’ Association (MBA) states that commercial and multifamily mortgage delinquency rates have been rising for the last two years. For some categories of lenders, delinquency rates are now higher than they were in the aftermath of the housing bust in the early 2000’s.
Hard to compare
An issue with data reported by the MBA is that each class of lender has a different definition of what constitutes a delinquent loan. For example, CMBS loans are considered delinquent if they are 30 or more days delinquent or in REO, but loans from banks and thrifts are not classed as delinquent unless they are 90 or more days delinquent or in non-accrual. Because of this, the MBA states that absolute delinquency rates cannot be compared between different classes of lenders. Therefore, they will be compared here on a relative basis.
The report provides year-end delinquency rates for each class of lender for the years 2005 to 2024. Here, we look at the data of each lender type relative to the average of their rates over this 20-year period. The results for the entire time span are shown in the first chart, below.
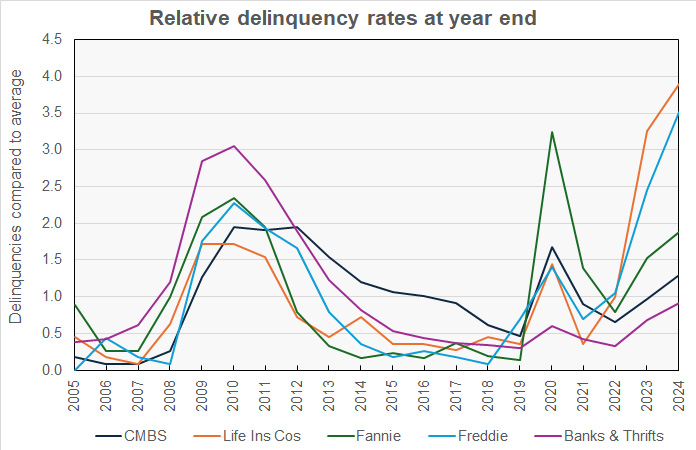
The chart shows that, of the lender types surveyed, the post-housing bust delinquency rate for loans originated by banks and thrifts rose to the highest level relative to its long-term average. However, bank and thrift relative delinquencies are the lowest today. Conversely, the relative delinquency rate for loans originated by life insurance companies was the lowest relative to its average after the housing bust, but it is the highest today.
Zooming in
The MBA provided quarterly data on delinquency rates for the period from Q4 2020 to Q4 2024. This data is plotted relative to the long-term year-end average in the next chart, below.
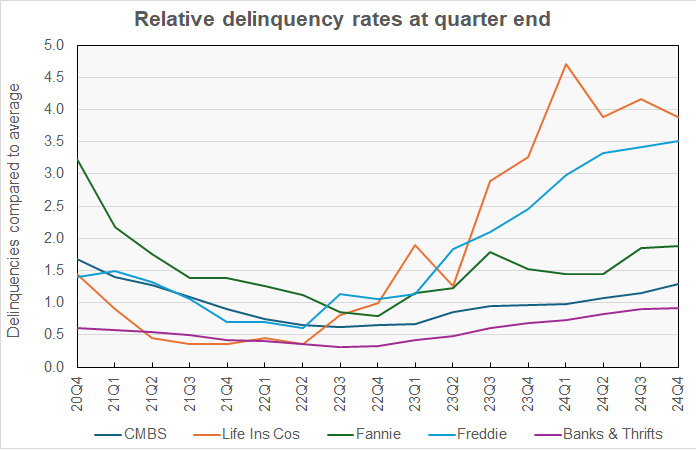
The chart shows that the relative delinquency rates for all lender types except for life insurance companies have been rising recently. The rate for life insurers is down from the high it reached in Q1 2024. Despite its recent decline, the relative delinquency rate for loans by life insurers came in at the highest level of those tracked at 3.9 times its 20-year average.
How bad is it really?
The above chart shows that the relative delinquency rate for banks and thrifts is currently the lowest for the lender types studied at 0.91 times its long-term average. However, this relatively low level is partly due to the high rates that bank and thrift delinquencies reached in the 2009 to 2011 time frame raising the average to which the current rate is being compared.
The last chart attempts to reduce the influence of the periods with abnormally high rates on the results by comparing the delinquency rates to the average of rates during the “relatively normal” years of 2005 through 2007 and 2015 through 2019.
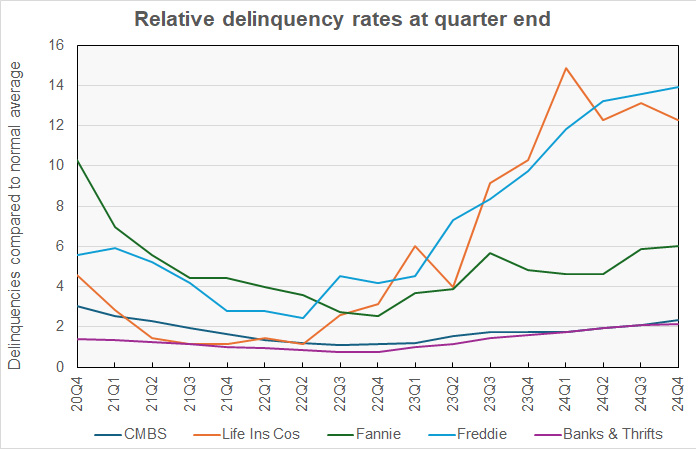
When compared to the “relatively normal” years, the current relative delinquency rate for banks and thrifts remains the lowest of those studied. However, rather than the current rate being 0.91 times the long-term average, it is 2.1 times the “normal” average. Compared on this basis, the relative delinquency rate for loans originated by Freddie Mac overtakes that of life insurers, with a current rate 13.9 times that seen during the “normal” years.
The freely-accessible MBA report does not separate out loans on multifamily property from those on other commercial property types. The free report is available here.


