

The latest commercial property price report from MSCI Real Capital Analytics said that multifamily property prices were up 0.2 percent month-over-month in February from the revised level of the month before. However, prices were down 1.3 percent year-over-year.
Defining CPPI
MSCI tracks an index called the Commercial Property Price Index (CPPI). The index is computed based on the resale prices of properties whose earlier sales prices and sales dates are known. The index represents the relative change in the price of property over time rather than its absolute price. Note that, as new property transactions are added to the MSCI dataset each month, they recalculate the CPPI for the months in which the transactions occurred, potentially all the way back to the beginning of the data series.
Multifamily property price picture brightens
The first chart, below, shows how the CPPI’s for all commercial property as a single asset class and for apartments have changed since January 2016. Both CPPI’s have been normalized to values of 100 in January 2012. The chart also contains trend lines showing the straight-line average rates of price appreciation for the two asset classes based on their performances from January 2012 to December 2019, a period in which property price appreciation was remarkably steady.
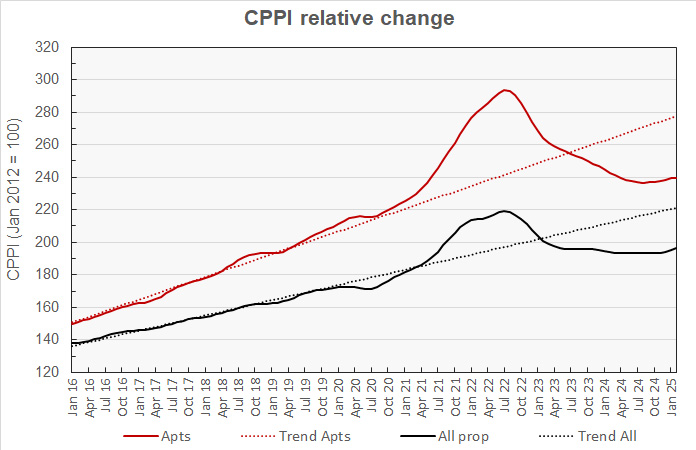
The chart shows that multifamily property prices have been rising since September of last year. However, the rate of increase has flattened out recently. The chart also shows that general commercial property prices have followed a similar pattern to that of multifamily property prices, but the excursions from the underlying trend have been more muted.
Multifamily property prices are now down 18.4 percent from their peak but are 13.5 percent above their level in January 2020. They are 13.7 percent below their pre-pandemic trend line.
Prices for all commercial property as a single asset class were up 0.6 percent month-over-month in February and were up 1.3 percent year-over-year. They are now 10.6 percent below their peak but are 14.0 percent above their level in January 2020. They are 11.3 percent below their pre-pandemic trend.
The next chart plots the month-over-month changes in the values of the CPPIs over the last 13 months for all commercial property as a single asset class and for apartments. It also includes the same metrics based on the data included in last month’s report and the report from the month before that.
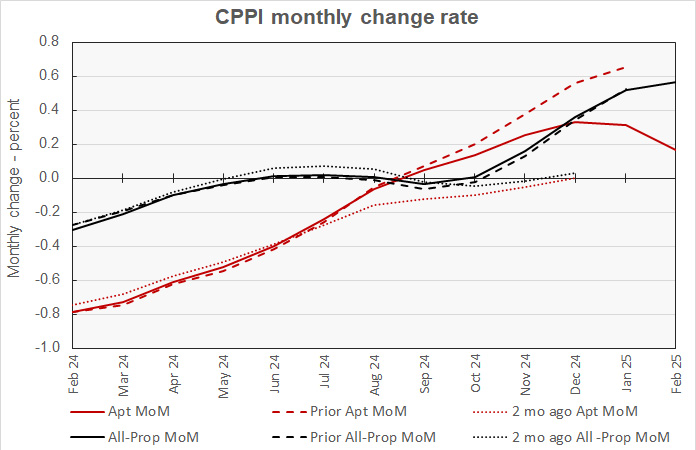
The chart shows that the new transaction data added a month ago resulted in a more positive view of the multifamily property price changes. However, the data added this month gave a more negative view of the price movements. The monthly rates of price appreciation have been revised downward since last October with the monthly rate of price appreciation actually declining over the past two months.
The chart also shows that that last month’s revisions to the pricing data for all commercial property considered as a single asset class made only minor changes to the price movement picture. Overall commercial property prices are continuing to rise at progressively higher rates.
Property prices higher for the month
For the first time in a long time MSCI Real Capital Analytics reported that property prices did not fall for the month in any of the property categories they track. Even office properties avoided a price drop this month. The best performing asset class was again retail, which saw a 0.8 percent price rise for the month. Prices for suburban offices rose 0.2 percent for the month while prices for offices within central business districts (CBDs) rose 0.5 percent. Prices for industrial properties moved 0.4 percent higher.
The pricing picture was not as bright on a year-over-year basis, with other property categories, in addition to apartments, seeing declines. Property prices for offices within CBDs fell 3.3 percent while those for suburban offices fell 0.7 percent. However, retail property prices were up 4.9 percent year-over-year while industrial property prices were up 4.6 percent.
Major metro commercial property prices cease falling
The MSCI report provides data comparing the price changes of commercial property in 6 major metro* areas against those in the rest of the country, although it does not separate apartments from other commercial property types in this comparison. The next chart, below, plots the history of the relative price indexes since January 2016 for both market segments, along with trend lines based on straight-line fits to the changes in these indexes between January 2012 and December 2019. For purposes of this chart, both price indexes were set to values of 100 for January 2012.
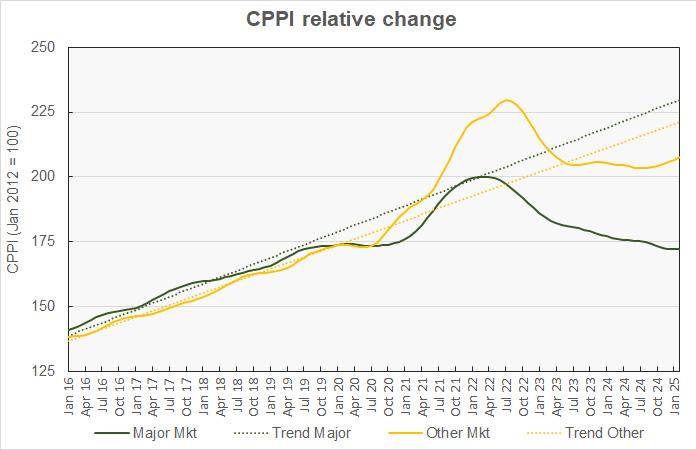
The chart shows that the aggregate CPPI for non-major metro commercial property has been on the upswing for several months. Even the CPPI for major metros appears to have stopped falling. The numbers show that the CPPI for major metros was effectively unchanged for the month in February while the CPPI for non-major metros rose by 0.4 percent for the month.
Major metro property prices are down 2.4 percent year-over-year. They are down 13.9 percent from their peak and are now 0.9 percent below their level in January 2020. They are 25.1 percent below their long-term trend.
The non-major markets CPPI is up 1.2 percent year-over-year. It has now fallen 9.7 percent from its peak but is 19.6 percent above its level in January 2020. The non-major metro CPPI is 6.2 percent below its pre-pandemic trend.
The final chart plots the history of the month-over-month changes in the price indexes for the two property market segments over the last 13 months along with the monthly price change data from the last two reports.
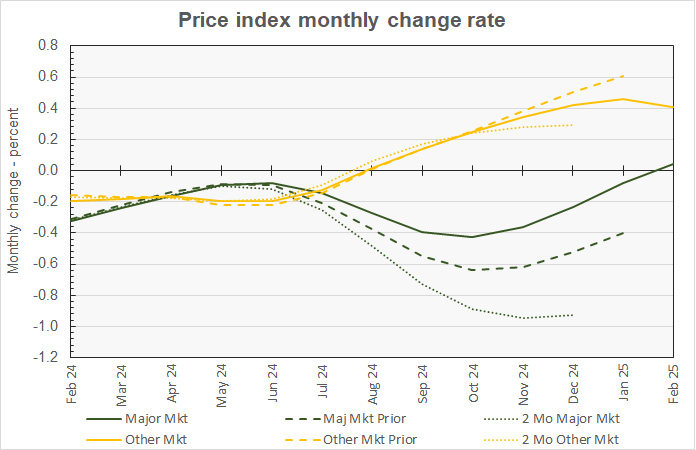
The chart shows that more significant revisions were made to last month’s pricing data for the major metro markets than for the non-major metro markets. In addition, the revisions made to the major metro data show that it has been performing better than initially thought with prices declining more slowly than the earlier data indicated. On the other hand, the latest revisions to the pricing data for non-major metros indicate a trend that is between the two previous trends.
The full report provides more detail on other commercial property types. Access to the MSCI Real Capital Analytics report can be obtained here.
*The major metros are Boston, Chicago, Los Angeles, New York, San Francisco and Washington DC.


