

The latest rent report from Apartment List shows that the national median monthly rent growth in March was +0.59 percent. Rents have now risen for 2 months in a row. However, year-over-year rent growth remains negative at -0.35 percent.
Apartment List reported the national median apartment rent to be $1,384, up $8 from last month’s revised figure.
Charting the data
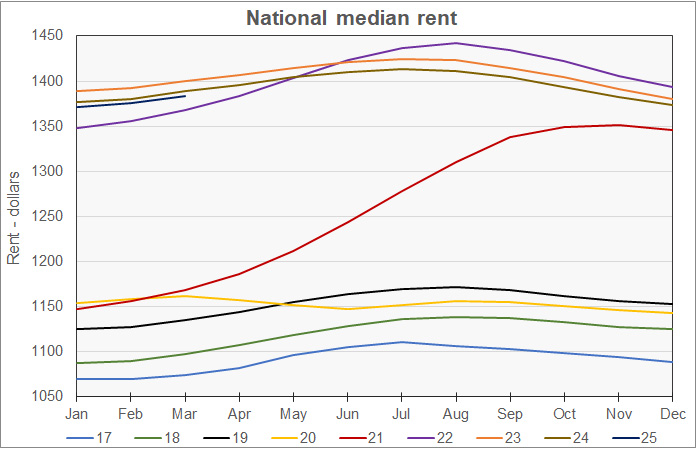
The first chart shows the history of the national median rent level since 2017. It is plotted year-by-year so that the annual change pattern is visible. The chart shows that, after deviating from the typical pattern in 2020 and 2021, rents returned to the annual cyclical pattern in about August 2022. However, unlike during the pre-pandemic era, rents have been declining on a year-over-year basis since then, although the rate of decline has been decreasing.
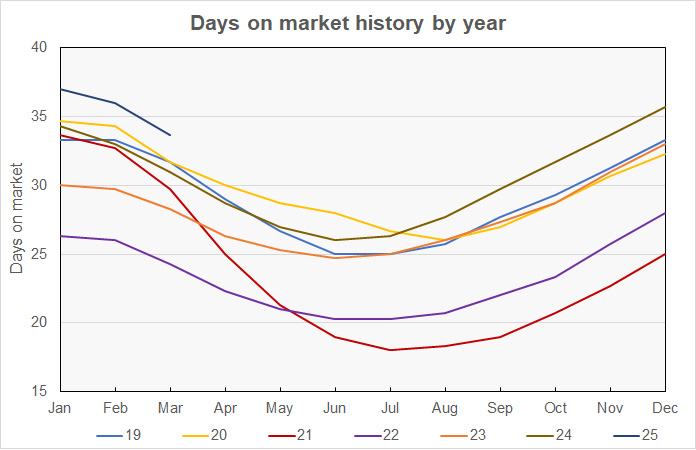
The next chart shows the national average number of days a unit listed on Apartment List stayed on the market until it was leased. The data also shows a clear seasonal pattern similar to that of rent changes. It also shows that apartments were leased very quickly in the second half of 2022, but that the time required to lease them has increased every year since then. By mid-2024, the time to lease an apartment grew to be longer than that of the same month in the pre-pandemic period. The time to lease in 2025 is longer still.
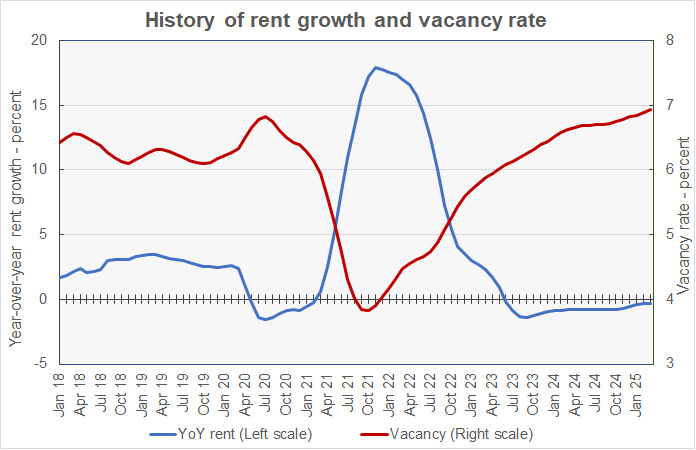
The next chart shows the year-over-year rate of rent growth since January 2018 plotted along with the national median apartment vacancy rate. The chart shows that the national average vacancy rate is again at its highest level since Apartment List began keeping records in 2017. Year-over-year rent growth remains negative and is well below its levels in 2018 and 2019, but it is creeping back toward zero.
The final chart shows the change in the national median apartment rent since January 2017 in nominal dollar terms along with two other measures of rent accounting for changes in income and price levels. The Income adjusted curve adjusts the rent by the change in average hourly earnings of all employees as reported by the Bureau of Labor Statistics. The Inflation adjusted curve adjusts the rent by the general change in price level as measured by the not-seasonally-adjusted Consumer Price Index for all urban consumers (CPI-U).
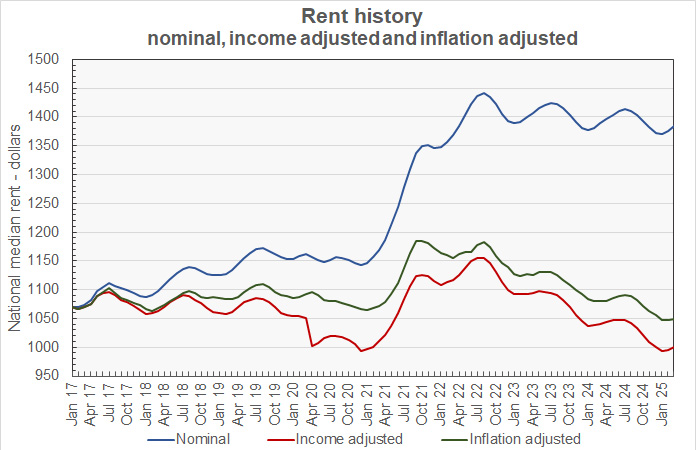
The curves show that, when adjusted for wage growth or for the general increases in prices, rents are below their pre-pandemic levels. Since January 2017, average rents are up 29.3 percent while average hourly earnings are up 38.4 percent and inflation as measured by the CPI-U is up 32.0 percent.
Ranking the metros
Apartment List provides the underlying data they collected in compiling their report and that data was used to create the tables, below. The tables look at the 50 most populous metropolitan statistical areas as defined by the US Census Bureau and identify the top and bottom 10 metros for year-over-year rent growth. The tables provide the median monthly rent in the metro, the percentage change from the prior month’s rent level (MoM Metro), the annual percentage change in rent (YoY Metro) and the metro’s vacancy rate. They also list the days on market (DOM) before lease metric, although this data is not available for all metro areas.
The first table shows the 10 metros with the largest annual rent percentage increases.
| Metro | Metro Rent | MoM Metro | YoY Metro | Vacancy rate | DOM |
| Providence | $1,470 | 2.55 | 4.9 | 4.1 | N/A |
| Chicago | $1,629 | 1.44 | 3.6 | 4.9 | 31.0 |
| Cleveland | $1,104 | (0.59) | 3.5 | 5.9 | N/A |
| San Jose | $2,972 | 1.30 | 3.5 | 5.2 | 33.3 |
| Kansas City | $1,319 | 0.56 | 3.3 | 6.7 | 39.3 |
| Washington DC | $2,188 | 0.93 | 3.3 | 5.5 | 32.0 |
| Baltimore | $1,764 | 0.79 | 3.2 | 5.4 | 27.0 |
| Hartford | $1,556 | 0.98 | 3.2 | 5.0 | 33.7 |
| Detroit | $1,218 | 0.64 | 3.1 | 5.1 | 25.3 |
| Virginia Beach | $1,572 | 0.95 | 3.1 | 6.0 | 25.7 |
The next table shows the 10 metros with the smallest annual rent increases.
| Metro | Metro Rent | MoM Metro | YoY Metro | Vacancy rate | DOM |
| Austin | $1,355 | 0.26 | (6.3) | 9.9 | 45.5 |
| Denver | $1,684 | 0.53 | (5.0) | 8.6 | 37.3 |
| Raleigh | $1,401 | 0.85 | (2.9) | 8.7 | 38.0 |
| Salt Lake City | $1,450 | 0.27 | (2.9) | 8.0 | 42.5 |
| Phoenix | $1,403 | 0.33 | (2.8) | 7.8 | 34.0 |
| Dallas | $1,436 | 0.47 | (2.6) | 8.6 | 37.7 |
| Jacksonville | $1,354 | 0.19 | (2.4) | 7.5 | 30.3 |
| San Antonio | $1,214 | 0.34 | (2.4) | 9.2 | 41.7 |
| Atlanta | $1,446 | 0.30 | (2.2) | 7.6 | 30.7 |
| Charlotte | $1,338 | 0.45 | (1.6) | 8.4 | 35.2 |
In March, 35 of the 50 most populous metros saw their rents rise on a year-over-year basis. In addition, all but one of the 50 most populous metros saw rents rise on a month-over-month basis.
The complete Apartment List report covers many more metros and also provides city, county and state data. It gives readers with the opportunity to download their data sets. The latest report can be found here.


