

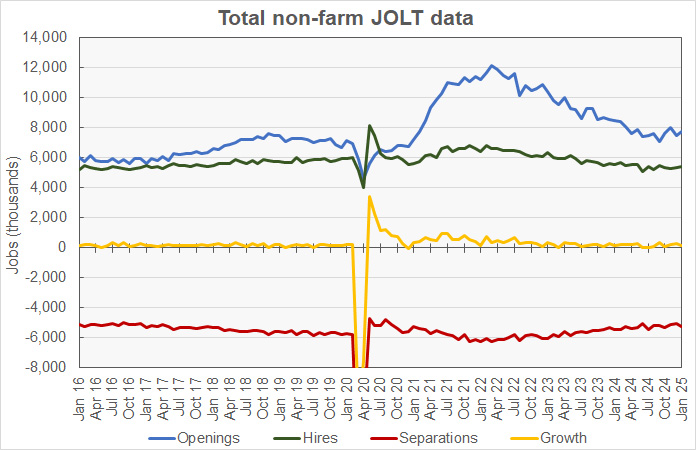
The Job Openings and Labor Turnover (JOLT) report from the Bureau of Labor Statistics (BLS) said that the number of job openings in January was 7.74 million. Job openings in both construction and in real estate renting and leasing were up for the month, sharply so for real estate renting and leasing.
As is usually the case for reports covering January, the figures given in this month’s report have been adjusted to reflect the latest population estimates from the Census Bureau. All figures back to January 2020 have been restated, so revisions to data from earlier months will be larger than is generally seen.
Job openings were reported to be up 232,000 openings month-over-month. However, the openings figure for December was revised lower by 92,000 openings, so the January openings figure is only 140,000 higher than the initial level reported for December last month. Job openings are down 728,000 openings from their year-ago level.
Hiring was reported to be up from last month’s revised (-88,000) figure for the economy as a whole, rising 19,000 to a level of 5.39 million hires. Total separations rose 170,000 from last month’s revised (-187,000) figure to a level of 5.25 million. Within total separations, quits were reported to rise 5.5 percent while layoffs fell 2.0 percent. Quits represented 62.2 percent of total separations for the month, slightly above the trailing 12-month average of 62.0 percent.
Overall hiring flat despite higher openings
The January job openings figure represents 4.6 percent of total employment plus job openings. For comparison, the unemployment rate in January was reported to be 4.1 percent and 6.85 million people were unemployed. Another 5.66 million people said that they would like a job but were not counted as being in the labor force since they were not actively seeking employment.
For a discussion of the JOLT report and how it relates to the Employment Situation Report, please see the paragraph at the end of this article.
The excess of hiring over separations in the January JOLT report implies an employment increase of 141,000 jobs for the month. Last month’s employment increase was revised to 292,000 jobs, up by 99,000 jobs from the gain reported last month.
Of those leaving their jobs in January, 3.27 million quit voluntarily, while 1.64 million people were involuntarily separated from their jobs. The remainder of people leaving their jobs left for other reasons, such as retirements or transfers. The portion of people quitting their jobs rose 0.1 percentage point from last month’s figure to 2.1 percent of the labor force. The involuntary separations rate was down slightly from last month’s figure at 1.0 percent.
Total non-farm JOLT data since January 2016 is shown in the first chart, below.
Construction job openings, hires and separations all rise
The next chart, below, shows the employment situation for the construction jobs market over the last 49 months. It shows that January saw a net gain of 18,000 construction jobs, down from last month’s revised gain of 59,000 jobs.
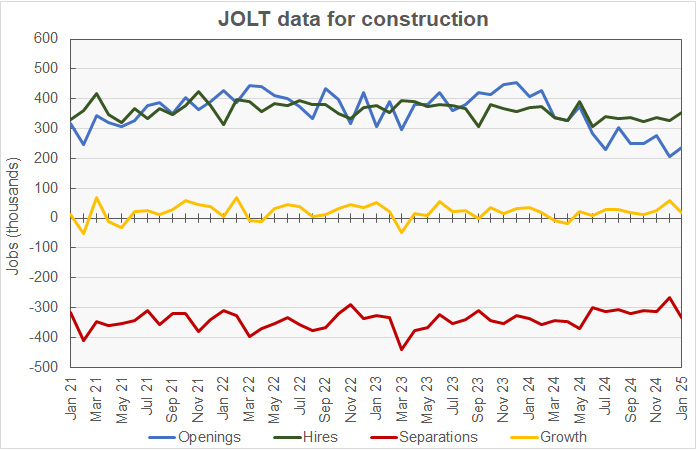
The preliminary job openings figure for January was reported to be up by 31,000 openings from last month’s revised (-12,000) figure at 236,000 openings. Openings were reported to be down 42.0 percent from last year’s level and were reported to represent 2.8 percent of construction employment plus job openings.
Hiring was reported to be up by 26,000 jobs in January from the prior month’s revised (+26,000) jobs figure at 353,000 new hires. The number of construction jobs that were filled in January was reported to be down 19.0 percent year-over-year.
Construction jobs total separations were reported to rise by 67,000 jobs from the prior month’s revised (-11,000) figure to 335,000 jobs.
Quits were reported to rise by 53,000 jobs from December’s revised (-4,000) figure to a level of 166,000 jobs. Quits represented 50.0 percent of separations for the month.
Layoffs were reported to rise by 12,000 from last month’s revised (-9,000) figure to 150,000 jobs.
“Other separations” which includes retirements and transfers, were reported to be up 2,000 at 19,000 jobs.
RERL job openings surge as layoffs fall
The last chart, below, shows the employment situation for the real estate and rental and leasing (RERL) jobs category. Employment in this jobs category was reported to be up 4,000 jobs for the month.
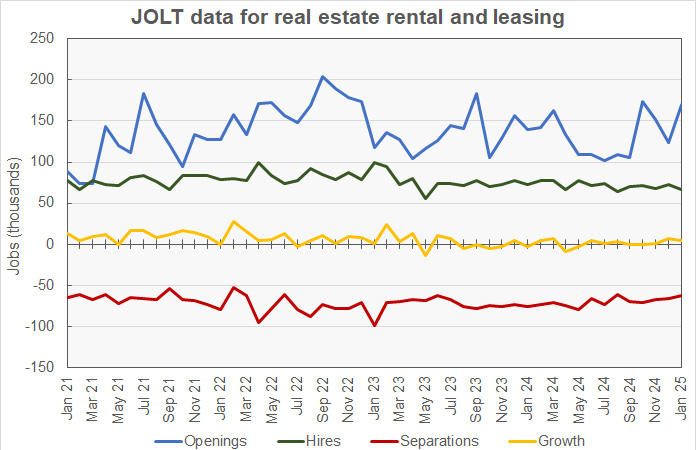
The number of job openings in the RERL category was reported to be 170,000 jobs at the end of January. This was up 46,000 job openings from the revised (-4,000) level reported for the month before. RERL job openings are up 21.4 percent from year-ago level. Job openings in the RERL category represent 6.4 percent of total employment plus job openings, up 1.6 percentage points from the level in last month’s report.
Hiring in January was reported to be down by 7,000 jobs from last month’s revised (+1,000) figure at 66,000 jobs. The hiring figure was down 9.6 percent from the level of the year before.
Total separations in the RERL jobs category in January were down by 4,000 from December’s revised (-4,000) figure at 62,000 jobs.
Quits were up by 12,000 from December’s revised (-1,000) figure at 51,000 jobs. Quits represented 82.3 percent of total separations. Layoffs were reported to fall by 14,000 from December’s revised (-3,000) figure to only 10,000 jobs.
The numbers given in the JOLT report are seasonally adjusted and are subject to revision. It is common for adjustments to be made in subsequent reports, particularly to the data for the most recent month. The full current JOLT report can be found here.
Comparing the reports
The US labor market is very dynamic with many people changing jobs in any given month. The JOLT report documents this dynamism by providing details about job openings, hiring and separations. However, it does not break down the jobs market into as fine categories as does the Employment Situation Report, which provides data on total employment and unemployment. For example, while the Employment Situation Report separates residential construction from other construction employment, the JOLT report does not. The Employment Situation Report separates residential property managers from other types of real estate and rental and leasing professionals, but the JOLT report does not. However, the JOLT report provides a look at what is driving the employment gains (or losses) in broad employment categories.


