

CoStar reported that its value-weighted index of multifamily property prices fell 0.15 percent month-over-month in March, slightly less than last month’s reported decline. This index was up 5.8 percent year-over-year.
By contrast, MSCI Real Capital Analytics reported that multifamily property prices were down 0.04 percent for the month and down 0.9 percent year-over-year in March.
The value-weighted index of non-multifamily commercial property rose 0.53 percent month-over-month in March. This index is down 1.7 percent year-over-year. The other commercial property types tracked by CoStar are office, retail, industrial and hospitality.
For more information on the CoStar Commercial Repeat Sales Indexes (CCRSI’s), please see the description at the bottom of this report.
Multifamily property prices turn lower
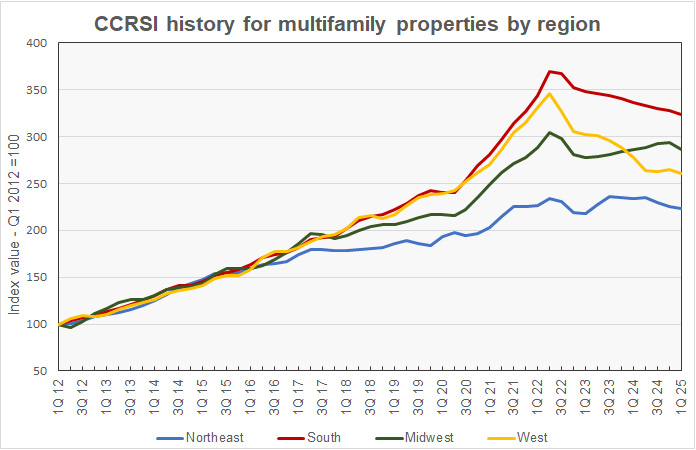
The first chart, below, shows the history of the value-weighted CCRSI’s since January 2016 for multifamily property and for all other commercial property considered as a single asset class. It also shows trend lines for the growth in the two CCRSI’s based on their growth in the period from January 2012 to January 2020. The indexes are normalized so that their values in December 2000 are set to 100.

The chart shows that multifamily property prices seemed to be on an upswing at the end of last year, but they have now been falling for the last two months. Multifamily property prices are down 22.4 percent from their 2022 high. They are also 12.1 percent below their pre-pandemic trend.
Prices for other commercial property types rose this month after being on a mild downward trajectory since last October. These prices are now 14.0 percent below their high point and 19.4 percent below their pre-pandemic trend.
The second chart shows the recent history of multifamily property prices and other commercial property prices based on this month’s data along with the estimates from last two month’s reports. For purposes of this chart, the price indexes for both property groupings were set to a value of 100 in January 2020 so that the indexes could be plotted together at a scale that would show the detailed price movements.
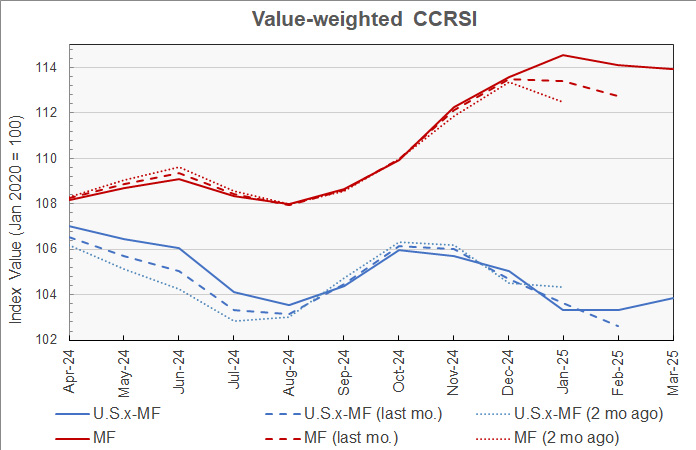
The chart shows that new transactions added to the data sets tended to raise the levels of the multifamily index for recent months. Prices which were originally seen as falling in January are now seen as rising. The effect of the new data on the index values for other commercial property is more mixed. The data updates for recent months did not change the picture in a consistent direction. However, the data updates did consistently raise the levels of the commercial property price index values between April and August 2024.
Tracking regional differences
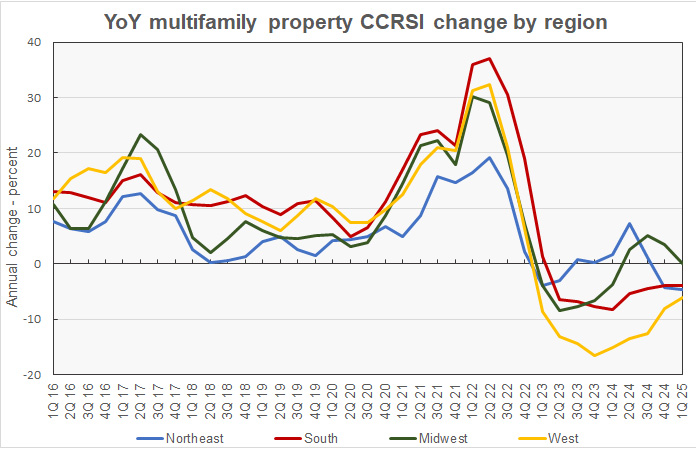
CoStar’s quarterly reports include information on changes in the equal-weighted CCRSI by property type by region. The history since Q1 2012 of these regional indexes for multifamily property is shown in the next chart, below. For purposes of this chart, the CCRSI’s for each of the four regions was normalized to a value of 100 in Q1 2012.
The chart shows that the multifamily property prices in the South have been on a steady downward trend since their post-pandemic peak. Multifamily property prices in the West have also been trending lower since their 2021 peaks, but not as steadily as have those in the South. Prices are off 24.7 percent in the West and 12.3 percent in the South from their peaks.
Multifamily property prices in the Northeast did not see as much of a post-pandemic surge as did those for the other regions. They also have not fallen as much. Prices in the Northeast are off 5.3 percent from their peak.
Multifamily property prices in the Midwest had been trending higher since Q1 2023. However, they took a step back this quarter and are now down 5.8 percent from their peak.
On a quarter-over-quarter basis, multifamily property prices in Q1 2025 were down across the board. Prices fell 0.6 percent in the Northeast, 1.2 percent in the South, 2.4 percent in the Midwest and 1.8 percent in the West.
The next chart shows the history of the year-over-year regional multifamily property price changes by quarter since 2016. The chart shows that the Midwest and Northeast regions had recently managed year-over-year price increases, but not this quarter.
Based on CoStar’s equal-weighted quarterly indexes and compared to year-earlier levels, prices in Q1 2025 were down 4.6 percent in the Northeast, 3.9 percent in the South and 6.1 percent in the West. Prices were unchanged in the Midwest.
Transaction volumes remain subdued
An issue with monthly transaction volume reporting is that CoStar usually identifies additional transactions to tabulate over the next few months after the initial report, and these extra transactions tend to make initial reports of rising transaction volumes appear less positive than they will subsequently appear. For example, CoStar reported that the transaction volume in March for all property types was down 78 transactions (6.1 percent) from the revised level of the month before, but it was up 104 transactions (9.4 percent) from the preliminary level for February reported last month.
CoStar reported that their initial transaction count for March was 1,205 repeat sales pairs. This is up from the 1,101 transaction pairs identified for February in last month’s report but down from the 1,283 transaction pairs identified for February in this month’s report.
The history of the revisions to the transaction counts for recent months is illustrated in the next chart. It shows that the number of transactions for October was initially given as 1,306 in the November report and has been updated in every subsequent report. While the size of the transaction count revision was largest in the next month’s report, additional transaction pairs for October continued to be identified in every subsequent report. The current report identifies 1,553 transactions for October. By contrast, transaction data for March only appears in the current (April) report and we can expect it to be revised next month.
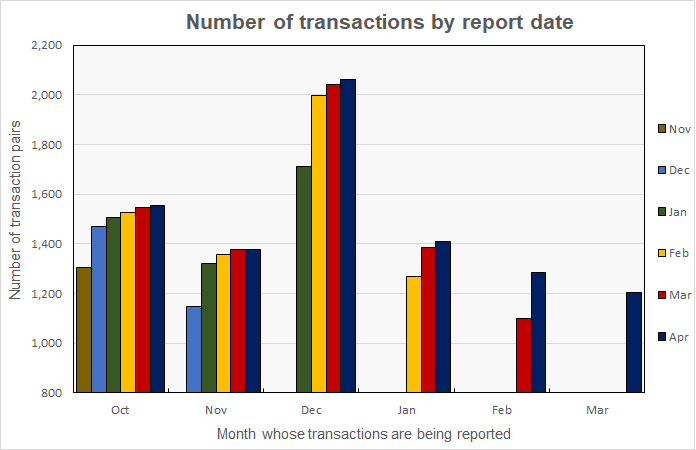
The preliminary dollar volume of transactions was reported to fall 0.2 percent from the revised level of the month before to $8.93 billion. However, the dollar volume of transactions increased 13.3 percent from the preliminary level reported last month.
The full report discusses all commercial property types. While the CoStar report provides information on transaction volumes, it does not break out multifamily transactions. The latest CoStar report can be found here.
CCRSI defined
The CoStar report focuses on a relative measure of property prices called the CoStar Commercial Repeat Sales Index (CCRSI). The index is computed based on the resale of properties whose earlier sales prices and sales dates are known. The index represents the relative change in the price of property over time rather than its absolute price. CoStar identified 1,205 repeat sale pairs in March for all property types. These sales pairs were used to calculate the results quoted here.
CoStar computes CCRSI’s for a variety of property groupings, combining them by cost, region, property type or other factors. The value-weighted index is more heavily influenced by transactions of expensive properties than is CoStar’s equal-weighted index. The value-weighted index is the focus of this report because it is an index whose value is reported monthly and for which CoStar breaks out multifamily property as a separate category.


