

The latest commercial property price report from MSCI Real Capital Analytics said that multifamily property prices were down 0.04 percent month-over-month in March compared to the revised level of the month before. Prices were down 0.9 percent year-over-year.
Defining CPPI
MSCI tracks an index called the Commercial Property Price Index (CPPI). The index is computed based on the resale prices of properties whose earlier sales prices and sales dates are known. The index represents the relative change in the price of property over time rather than its absolute price. Note that, as new property transactions are added to the MSCI dataset each month, they recalculate the CPPI for the months in which the transactions occurred, potentially all the way back to the beginning of the data series.
Multifamily property prices drop fractionally
The first chart, below, shows how the CPPI’s for all commercial property as a single asset class and for apartments have changed since January 2016. Both CPPI’s have been normalized to values of 100 in January 2012. The chart also contains trend lines showing the straight-line average rates of price appreciation for the two asset classes based on their performances from January 2012 to December 2019, a period in which property price appreciation was remarkably steady.
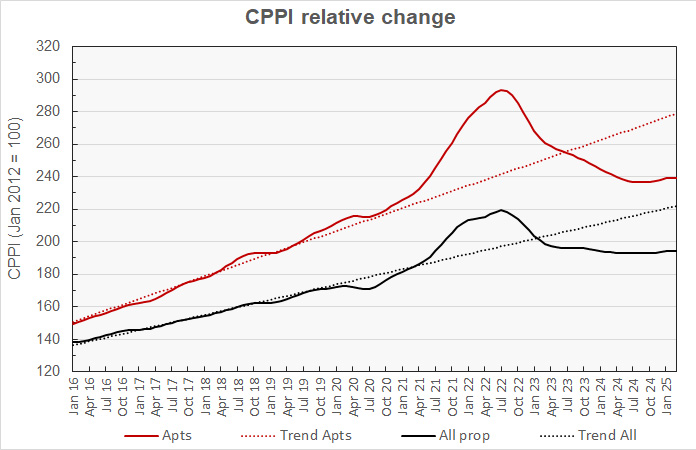
The chart shows that multifamily property prices seemed to have turned a corner and began to rise again in September 2024. However, their upward momentum has been fading recently. The chart also shows that general commercial property prices have been relatively flat for nearly two years. They are now sitting at the same level as they were in January 2024.
Multifamily property prices are now down 18.5 percent from their peak but are 13.2 percent above their level in January 2020. They are 14.3 percent below their pre-pandemic trend line.
Prices for all commercial property as a single asset class were up 0.05 percent month-over-month in March and were up 0.6 percent year-over-year. They are now 11.3 percent below their peak but are 13.0 percent above their level in January 2020. They are 12.4 percent below their pre-pandemic trend.
The next chart plots the month-over-month changes in the values of the CPPI over the last 13 months for all commercial property as a single asset class and for apartments. It also includes the same metrics based on the data included in last month’s report and the report from the month before that.
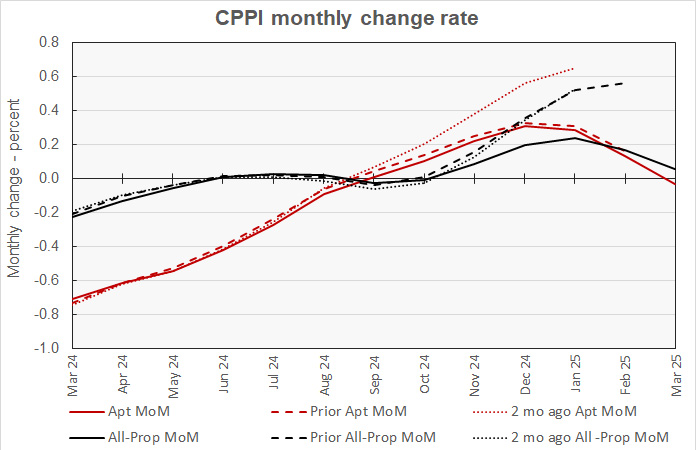
The chart shows that, two months ago, multifamily property prices seemed to be on an upward path with the rate of increases accelerating month-by-month. However, the new transaction data added last month painted a different picture with the rate of price growth slowing. This month’s data continued last month’s trend with multifamily property prices decreasing slightly month-over-month.
The chart also shows that that the pricing data for all commercial property from two months ago and from last month showed almost identical trends. However, new data added this month shows a slower rate of price growth over the last 4 months. Overall commercial property prices are now seen to be rising only slowly.
Trend reversal
In a reversal of recent price growth patterns, prices for industrial property fell for the month while prices rose for the other property types tracked. Prices for industrial properties fell by 0.1 percent for the month. Prices for retail saw a 0.5 percent price rise for the month. Prices for suburban offices rose 0.8 percent for the month while prices for offices within central business districts (CBDs) rose 0.5 percent.
On a year-over-year basis, both office and apartment properties saw declines. Property prices for offices within CBDs fell 1.5 percent although prices for suburban offices saw a 0.5 percent increase. Retail property prices were up 4.6 percent year-over-year while industrial property prices were up 2.3 percent.
Major and non-major property price trends diverge
The MSCI report provides data comparing the price changes of commercial property in 6 major metro* areas against those in the rest of the country, although it does not separate apartments from other commercial property types in this comparison. The next chart, below, plots the history of the relative price indexes since January 2016 for both market segments, along with trend lines based on straight-line fits to the changes in these indexes between January 2012 and December 2019. For purposes of this chart, both price indexes were set to values of 100 for January 2012.
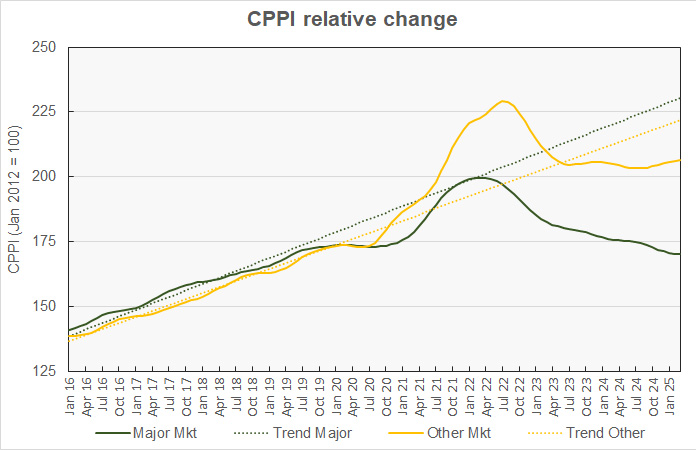
The chart shows that the CPPI for major metro commercial property was much harder hit during the pandemic than was that for non-major metros and that the divergence in price trends has continued. Prices in major metros have fallen every month since April 2022. However, property prices in non-major metros achieved some growth in the fall of 2023 and have been rising since last August.
Major metro property prices are down 0.2 percent month-over-month and 2.4 percent year-over-year. They are down 14.9 percent from their peak and are now 2.0 percent below their level in January 2020. They are 26.2 percent below their long-term trend.
The non-major markets CPPI is up 0.08 percent month-over-month and 0.8 percent year-over-year. It has now fallen 10.0 percent from its peak but is 19.0 percent above its level in January 2020. The non-major metro CPPI is 7.0 percent below its pre-pandemic trend.
The final chart plots the history of the month-over-month changes in the price indexes for the two property market segments over the last 13 months along with the monthly price change data from the last two reports.
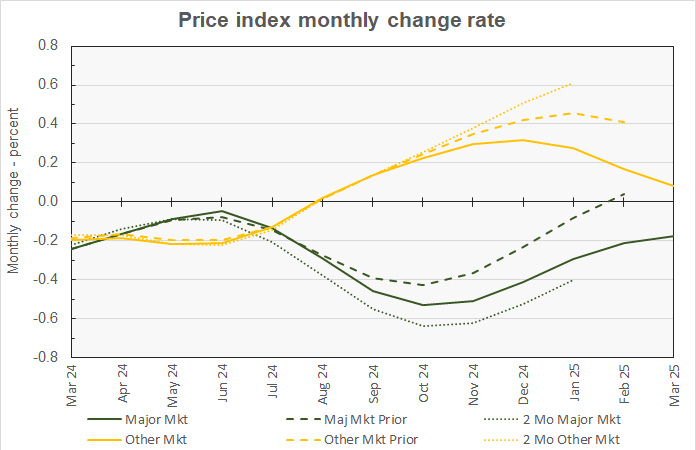
The chart shows that the updates to the pricing data for the non-major metros show a progressively less positive picture. For example, the month-over-month price growth for January was initially reported to be 0.61 percent, but it was revised down to 0.46 percent last month and to 0.28 percent this month. The current trajectory would seem to put price growth near break-even next month if it continues.
The revisions made to the major metro price data don’t show a clear trend. Rather, the updates seem to indicate that the data is converging on a central trend that is between the trends indicated in the prior two reports.
The full report provides more detail on other commercial property types. Access to the MSCI Real Capital Analytics report can be obtained here.
*The major metros are Boston, Chicago, Los Angeles, New York, San Francisco and Washington DC.


