

Redfin’s rent report for March says that the national median asking apartment rent growth was 0.4 percent for the month, with rents reaching a level of $1,610. However, the median rent was down 0.6 percent year-over-year.
A different look
Unlike rent reports from Apartment List and Yardi Matrix which report their measures of apartment rent month-by-month, Redfin reports rents on a trailing 3-month average basis. This method of reporting will tend to smooth out the noise in the data, but it may be less quick to show sudden variations in the underlying data trends.
Redfin’s report focuses on the 50 largest metros in the country. However, Redfin only had sufficient rent data on 44 of these metros in order to confidently quote results.
A summary of the March results from these three sources is contained in the following table:
| Source | Median rent | MoM rent growth percent | YoY rent growth percent |
| Redfin | $1,610 | +0.4 | -0.6 |
| Yardi Matrix | $1,755 | -0.2 | +1.0 |
| Apartment List | $1,384 | +0.6 | -0.4 |
As mentioned, Redfin focuses on the 50 largest metro areas defined by the Census Bureau. Yardi Matrix tracks results from 136 metro areas, but they may divide large Census Bureau metro areas into two. Apartment List has reports on 202 metro areas and attempts to model rents from the entire universe of rental properties, not just those that are professionally managed. The differences in the market segments covered and how the data is processed may explain the differences in results.
A historical view
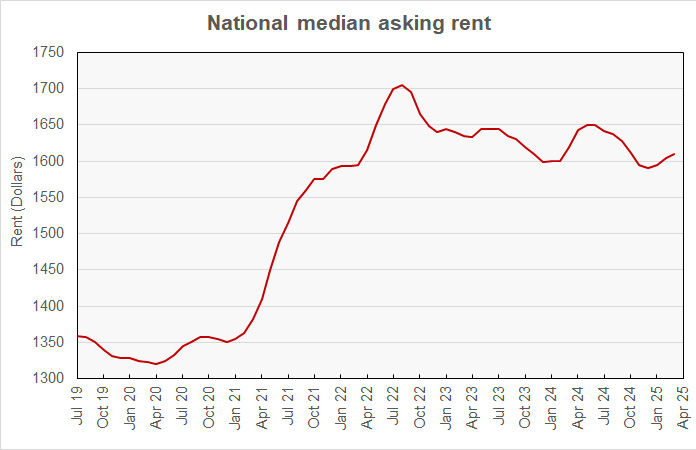
The history of the national median apartment rent as measured by Redfin is show in the chart, below. It shows that rents have been trending upward since January, but they remain 5.6 percent below the peak they reached in August 2022.
Leaders and trailers
The first table shows the 10 metros with the highest rate of year-over-year rent growth. Cities in the Midwest and Northeast are well represented.
| Metro | Median asking rent | MoM rent growth percent | YoY rent growth percent |
| Cincinnati | $1,435 | -1.2 | 12.1 |
| Providence | $2,166 | 0.6 | 11.4 |
| Cleveland | $1,300 | 2.0 | 10.6 |
| Washington DC | $2,061 | 1.1 | 8.5 |
| Baltimore | $1,606 | 0.4 | 8.4 |
| Boston | $2,787 | 2.7 | 6.9 |
| Pittsburgh | $1,475 | 1.7 | 6.9 |
| Louisville | $1,270 | 0.4 | 6.1 |
| Virginia Beach | $1,559 | 0.6 | 5.8 |
| Birmingham | $1,383 | 0.7 | 5.6 |
The second table shows the metros with the lowest rate of year-over-year rent growth. Austin, a leader for new apartment deliveries, leads the list. Other metros with high levels of new deliveries are also prominent on the list.
| Metro | Median asking rent | MoM percent | YoY percent |
| Austin | $1,420 | 0.2 | -10.7 |
| San Diego | $2,677 | 0.9 | -9.7 |
| Minneapolis | $1,526 | 0.1 | -7.8 |
| Portland | $1,765 | 0.9 | -7.8 |
| Raleigh | $1,430 | 0.9 | -6.8 |
| Salt Lake City | $1,521 | 1.5 | -6.7 |
| Jacksonville | $1,479 | 1.9 | -6.1 |
| Dallas | $1,455 | 0.4 | -5.4 |
| St Louis | $1,275 | 1.9 | -4.3 |
| Orlando | $1,740 | 0.3 | -3.9 |
The full report from Redfin also discusses rent growth history by number of bedrooms in the apartment. It is available here.


