

Yardi Matrix reported that the national average asking apartment rent was up $5 in March compared to the revised level of the month before at $1,755 per month. The national average year-over-year asking apartment rent growth was +1.0 percent, down 0.2 percentage points from the rate reported last month. The month-over-month rent growth rate was 0.3 percent.
Rents in the “lifestyle” asset class, usually Class A properties, were up 0.2 percent year-over-year. Rents in “renter by necessity” (RBN) properties increased by 1.9 percent year-over-year. The lifestyle rent growth is down 0.2 percentage points from last month’s rate while the RBN rent growth is down 0.1 percentage point. The chart, below, shows the history of the year-over-year rent growth rates for these two asset classes along with the difference between these rates.
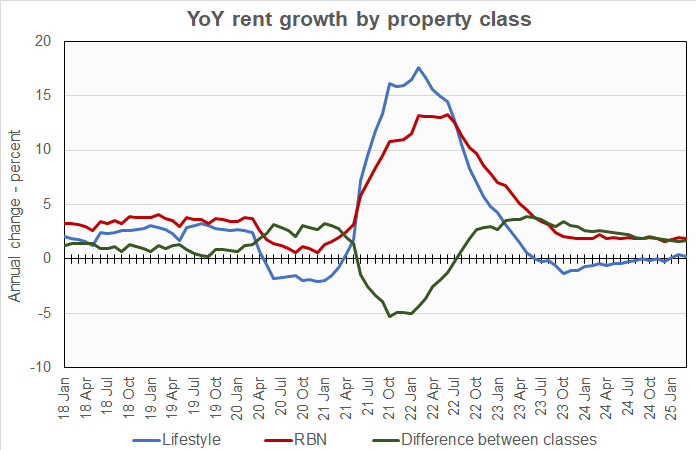
The year-over-year rent growth rate for lifestyle properties has now been positive for 3 consecutive months after being negative for 16 of the 18 previous months. However, it is still well below the average of nearly 2 ½ percent it maintained in the two years leading up to the pandemic. Rent growth for RBN properties has been hovering around 2 percent for the last year. It had been about 3 ½ percent before the pandemic
Yardi Matrix reported that the U.S. average occupancy rate in February was unchanged from that reported last month at 94.5 percent, an unusually low rate that is being maintained by the current high levels of deliveries of new units.
Uncertainty reigns
The discussion section of this month’s report focused on the policy changes being discussed or implemented by the Trump administration and their potential impact on housing.
On the positive side of the scale, the Trump administration is looking for ways to purpose some of the 500 million acres of land that the Federal Government owns for housing. It is also looking to extend the Opportunity Zone program that led to the creation of 300,000 housing units in low-income communities over its first 5 years. It may also be considering expanding the LIHTC program, the principal Federal program for encouraging low-income housing to be built.
On the negative side, the Trump administration has suspended or terminated some other programs that also supported the preservation or development of affordable housing.
In a move that could be good or bad, the administration is also looking at finally releasing Fannie Mae and Freddie Mac from their “temporary” conservatorship, which has been in place for over 16 years.
Tabulating the data
Yardi Matrix reports on other key rental market metrics in addition to rent growth. These include the year-over-year job growth rate based on the 6-month moving average and the completions over the prior 12 months as a percentage of existing stock. The 10 metros with the largest annual apartment rent increases are listed in the table below, along with the other data.
| City | YoY rent | YoY rent last month |
YoY jobs (6 mo moving avg) |
Completions as % of stock |
| New York | 5.5 | 5.6 | 2.0 | 1.6 |
| Chicago | 3.7 | 3.6 | 0.6 | 1.7 |
| Kansas City | 3.7 | 4.1 | 1.0 | 2.6 |
| Columbus | 3.5 | 3.8 | 0.9 | 3.8 |
| Philadelphia | 3.2 | 3.1 | 0.9 | 1.9 |
| Indianapolis | 3.1 | 3.2 | 1.2 | 3.3 |
| Washington DC | 2.8 | 3.1 | N/A | N/A |
| Detroit | 2.7 | 3.5 | 0.6 | 0.5 |
| New Jersey | 2.6 | 3.4 | 1.8 | 2.7 |
| Baltimore | 2.4 | 2.4 | 0.8 | 0.7 |
The major metros with the smallest year-over-year apartment rent growth as determined by Yardi Matrix are listed in the next table, below, along with the other data as in the table above.
| City | YoY rent | YoY rent last month |
YoY jobs (6 mo moving avg) |
Completions as % of stock |
| Austin | (5.4) | (5.1) | 2.1 | 8.8 |
| Denver | (3.6) | (3.1) | 0.5 | 6.2 |
| Phoenix | (3.0) | (2.2) | 0.6 | 5.2 |
| Dallas | (1.7) | (1.5) | 1.3 | 3.9 |
| Atlanta | (1.6) | (1.8) | 1.2 | 3.9 |
| Raleigh | (1.5) | (1.7) | 1.9 | 6.2 |
| Orlando | (1.3) | (1.6) | 1.9 | 6.0 |
| Nashville | (1.0) | (0.7) | 1.3 | 6.2 |
| Miami Metro | (0.4) | 0.4 | 1.4 | 4.4 |
| Houston | 0.1 | 0.1 | 1.4 | 2.3 |
The top metros for month-over month rent growth in March were Chicago, Charlotte, Seattle and Boston. Of these, only Chicago was in the top 4 in last month’s report and, two months ago, Boston was in the bottom 4. The trailing metros this month were Phoenix, Miami, Austin and Portland. Of these, only Raleigh was in the bottom 4 in last month’s report.
Single-family rentals rents flat for the month
Yardi Matrix also reported that single-family rental (SFR) rents rose $5 in March from the revised level of the month before to $2,169 per month. The year-over-year SFR rents were effectively unchanged, which is down from last month’s rent growth rate of +0.2 percent.
Yardi Matrix reported on the top 34 markets for built-to-rent single-family rentals, 14 of which saw rents grow year-over-year in March. The leading markets for year-over-year rent growth were Detroit, Inland Empire, Nashville and Kansas City.
The markets with the lowest year-over-year rent growth were Austin, Pensacola, Raliegh and Miami.
The national occupancy rate for single-family rentals remained at 94.7 percent. This is unchanged for the month but down 0.7 percent year-over-year.
This month, 11 of the metros saw year-over-year occupancy increases. The metros with the largest year-over-year occupancy increases were Jacksonville, Austin, Salt Lake City and Atlanta. The metros with the greatest occupancy declines were Greenville, Detroit, Harrisburg and Las Vegas.
The complete Yardi Matrix report provides information on some of the smaller multifamily housing markets and more information on the differences in results between lifestyle and RBN properties. It can be found here.


