

The Census Bureau’s quarterly report on home ownership and occupancy for Q1 2025 stated that the rental housing vacancy rate was 7.1 percent, up 0.2 percentage points since last quarter’s report. The report found a slight drop in the total number of U.S. households, which is not uncommon for Q1 reports. However, the drop was due to a sharp decline in the number of home-owning households while the number of renting households jumped.
Vacancies rising
The headline vacancy rate reported by Census is for all rental housing in the country, both single-family and multifamily. Census breaks down this figure in various ways, including by the number of units in the building. The chart, below, illustrates this comparison.
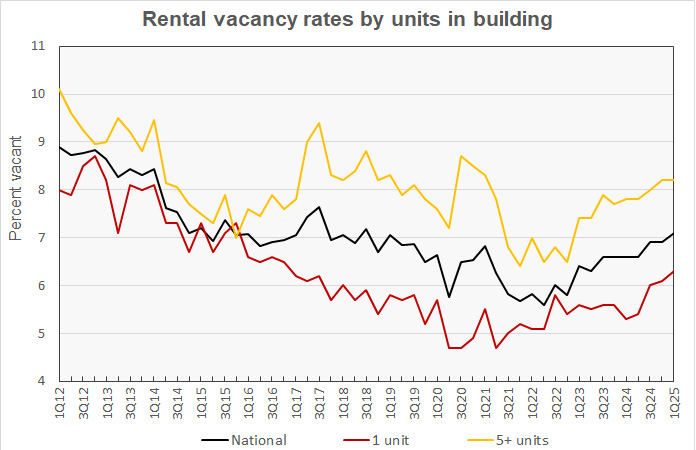
The chart shows that the national rental housing vacancy rate has been moving higher since early 2022 and that the vacancy rate for single-family housing has consistently been lower than that for multifamily housing with 5+ units per building.
In Q1, vacancies for multifamily housing with 5+ units per building as measured by the Census Bureau remained unchanged at 8.2 percent. However, the single-family rental vacancy rose 0.2 percentage points to 6.3 percent. One year ago, the single-family vacancy rate measured by the Census Bureau was only 5.3 percent.
Note that Apartment List reported that the multifamily rental vacancy rate at the end of March was 6.9 percent. By contrast, Yardi Matrix reported the multifamily rental vacancy rate in March as 5.5 percent. While the Census Bureau attempts to capture data representing all rental housing in the country, other data sources may focus on subsets of the market like professionally managed properties and so they come up with different results.
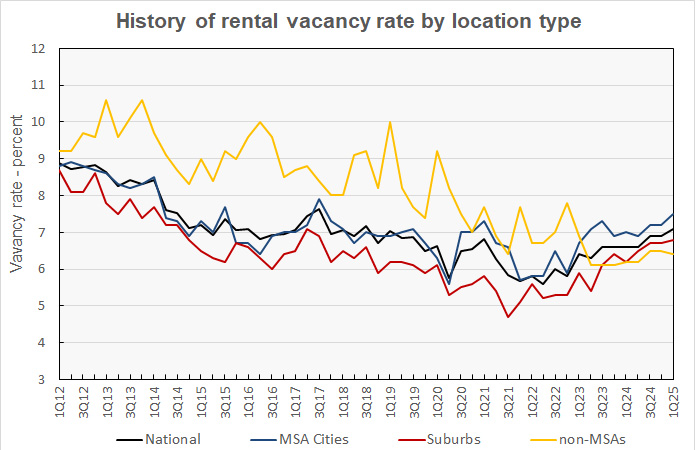
The Census Bureau reported that the rental vacancy rate in the core cities of the Census Bureau’s Metropolitan Statistical Areas (MSAs) was 7.5 percent in Q1 2025, this is up 0.3 percentage points from the value reported for each of the two previous quarters. The rental vacancy rate in the suburbs of the MSAs was 6.8 percent in Q1 2025, up 0.1 percentage point. These trends are shown in the next chart, below.
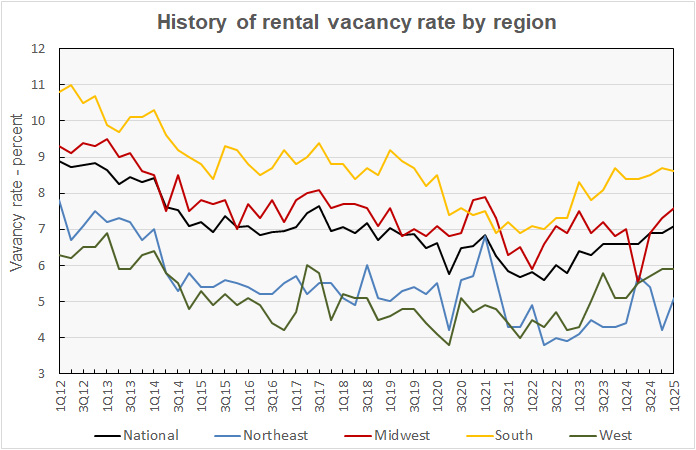
The rental vacancy rate history for each of the Census regions is shown in the next chart, below. After dipping last quarter, the reported vacancy rate rebounded in the Northeast, rising 0.9 percentage points to 5.1 percent. The vacancy rate was reported to rise 0.3 percentage points to 7.6 percent in the Midwest. The reported vacancy rate fell 0.1 percentage point in the South to 8.6 percent. It was unchanged in the West, remaining at 5.9 percent.
Census reported that 66.0 percent of vacant rental units were in structures with 2 or more units. About 25.4 percent of the vacant rental units had 3 or more bedrooms, with 1 bedroom units comprising 34.7 percent and 2 bedroom units comprising 37.5 percent of vacant stock. The median unit vacancy duration for rental properties in Q1 2025 was 3.1 months, up from 2.9 months one year earlier.
Rentership rate sharply higher
The Census Bureau reported that 34.9 percent of the country’s 132,236,000 occupied housing units were inhabited by renter households in Q1 2025. This rate is up 0.6 percentage points from that in Q4.
The history of the number of occupied housing units and the share of renter households since 2012 is shown in the next chart, below. The chart shows that the reported number of renter households jumped by 687,000 in the quarter and was up by 1.147,000 since Q1 2024. There were 46,149,000 renter households identified in Q1 2025.
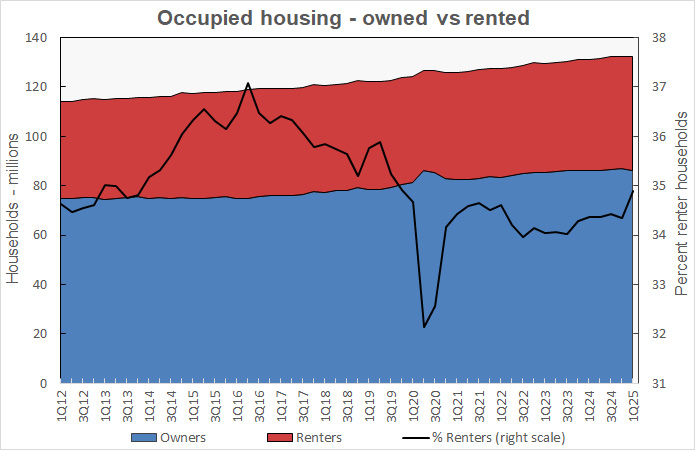
The number of homeowning households fell by 857,000 in the quarter to 86,086,000 households. However, the number of homeowning households was still up 106,000 from Q1 2024.
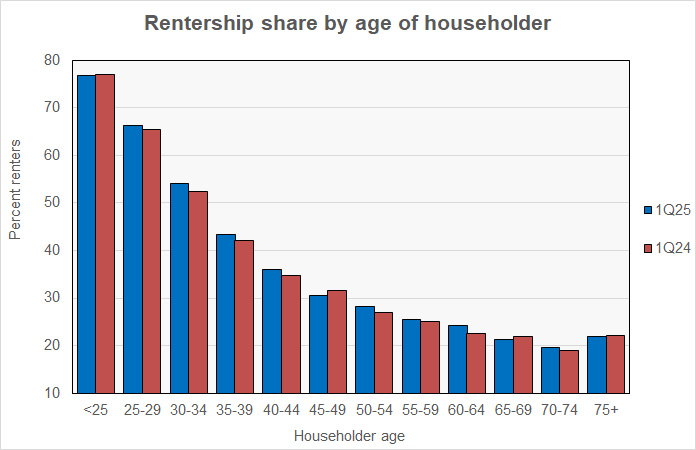
The Census Bureau also reported on the rentership rate by the age of the head of household. The results for the Q1 2025 and for Q1 2024 are illustrated in the next chart. It shows that the share of renter households rose for most age groups, with only 4 age groups showing a decline. Perhaps unexpectedly, one of the groups showing a decline in rentership rate was households headed by a person under the age of 25.
Census reports rents fall, but more slowly
The Census Bureau also tracks the median asking rents for the country as-a-whole. The history of their findings along with the year-over-year rent growth rate is shown in the next chart, below.
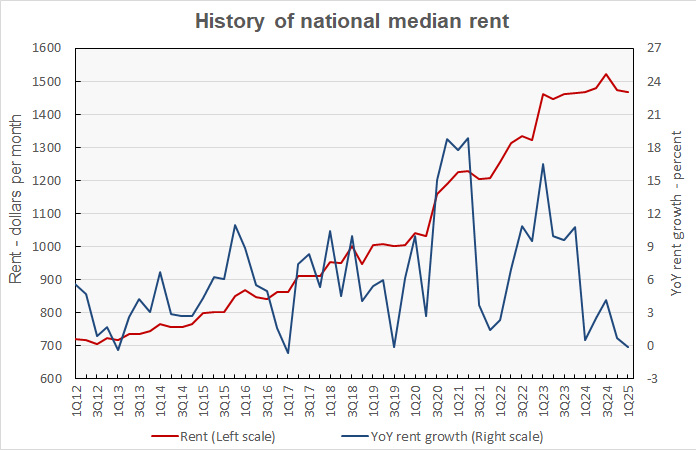
Census reported that monthly rents fell $7 per month in Q1 2025, moderating last quarter’s rate of decline when rents fell $48. Census reported the national median rent to be $1,468 per month, a fall of 0.5 percent from the prior quarter and a fall of 0.1 percent year-over-year.
By contrast, Yardi Matrix reported that the national average apartment rent in December was $1,755 per month. Apartment List reported the national average apartment rent in March was $1,384 per month.
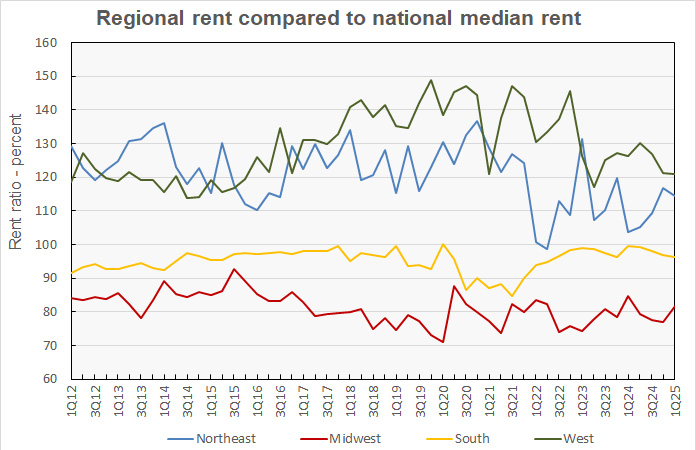
The last chart, below, shows the history of the median rent by Census region as a percentage of the national median rent. Rents were 14.5 percent higher than the national median in the Northeast, and 21.1 percent higher in the West. Rents were reported to be 18.2 percent lower than the national median in the Midwest and 3.7 percent lower in the South.
The Census report is called Quarterly Residential Vacancies and Homeownership, First Quarter 2025. It is available here.


