

A report from the Mortgage Bankers’ Association (MBA) says that multifamily mortgage originations were up 39 percent year-over-year in Q1. Originations of all commercial mortgages as a single asset class rose 42 percent year-over-year.
Commercial mortgage originations continue pre-pandemic pattern
The first chart, below, shows the MBA’s quarterly origination volume indexes since Q1 2016 both for all commercial mortgages as a single asset class and for multifamily mortgages. The indexes are reported relative to the year 2001, with the average quarterly volume in that year defined as a value of 100.
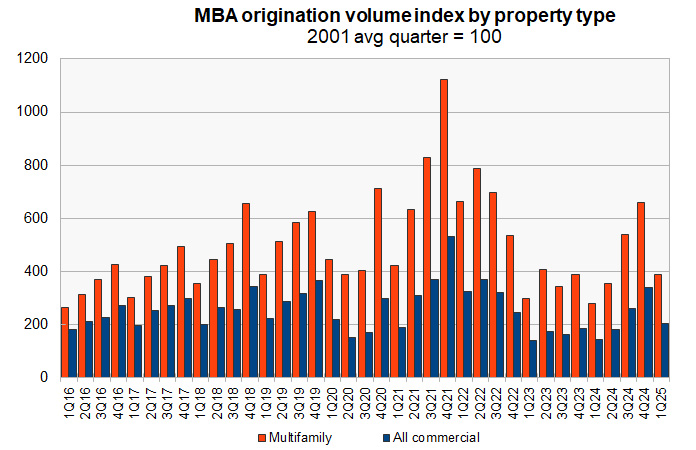
The usual pre-pandemic pattern of mortgage origination volume was for origination volume to increase quarter-by-quarter through the year with Q1 mortgage origination volume declining from the level in Q4 of the previous year. The origination volume each quarter would be higher than that of the same quarter of the previous year.
Origination volume for multifamily mortgages in Q1 2025 followed the pre-pandemic pattern in that the volume of originations was down 41 percent from the level in Q4, despite the year-over-year increase. However, the year-over-year increase in Q1 2025 origination volume greatly exceeded the average for the 5 years leading up to the pandemic. Between 2016 and 2020, the year-over-year Q1 origination volume growth averaged 11.5 percent and did not exceed 17.5 percent, both much lower than this year’s increase.
The report covers originations for 5 other commercial property categories. They are office, retail, industrial, hotel and health care.
Mortgage originations for office property surged 205 percent year-over-year from its recent depressed level and rose 44 percent quarter-over-quarter. Retail property originations fell 3 percent year-over-year and 66 percent quarter-over-quarter. Industrial mortgage originations fell 2 percent year-over-year and 43 percent quarter-over-quarter. Hotel originations rose 30 percent year-over-year but fell 64 percent quarter-over-quarter. Health care originations rose 159 percent year-over-year but fell 34 percent quarter-over-quarter.
Who’s lending?
The MBA report also includes data on the sources of the commercial mortgages being originated. However, this section of the report does not break out multifamily mortgages from lending on other types of commercial real estate.
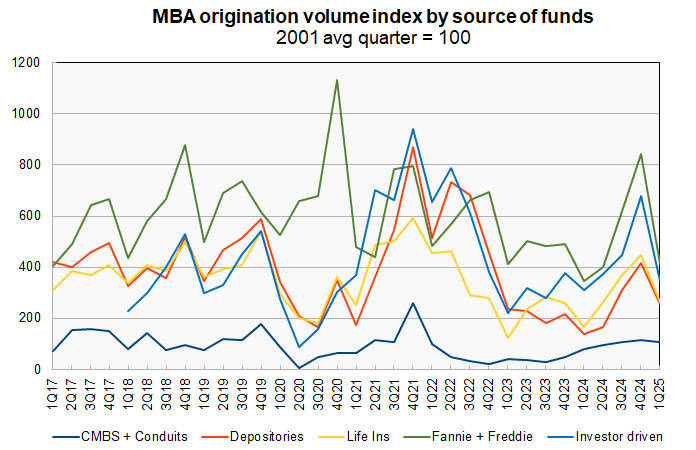
The report provides data on five categories of lenders: commercial mortgage-backed securities (CMBS) and conduits, depositories (aka commercial banks and savings and loans), life insurance companies, the government sponsored entities (GSEs), Fannie Mae and Freddie Mac, and investor-driven lenders such as REITs and specialty finance companies. The index values are quoted relative to the average quarterly origination volumes in the year 2001. The index values of different originators cannot be used to compare their absolute levels of mortgage originations since their origination levels in the baseline year of 2001 were different.
To gain insight into the absolute levels of funding provided by the different classes of originators, readers should look to the MBA’s report on mortgage debt outstanding, which also takes dispositions into account. However, the origination index values can be compared to see which classes of originators are actively lending today and which are not.
The final chart shows the history of commercial mortgage origination volume indexes since Q1 2017 by class of lender. It shows that the pattern of commercial mortgage origination volumes dropping from Q4 to Q1 was generally maintained for all of the lender types outside of the post-pandemic years. This pattern is strongly visible in this year’s data. The chart also shows that the Q1 origination volumes for most classes of lenders have not significantly increased over their long-term averages, with only the origination volume for depositories rising more than 10 percent.
The GSEs, who held 49.3 percent of multifamily mortgages as of Q4, saw their originations fall by 51 percent quarter-over-quarter. Depositories, who hold 29.2 percent of multifamily mortgages, decreased their originations 39 percent quarter-over-quarter. Life insurers, who hold 11.8 percent of multifamily mortgages, decreased their originations by 40 percent compared to Q4. CMBS and conduits, who held 3.2 percent of multifamily mortgages, decreased their originations by 6 percent quarter-over-quarter while investor-driven lenders decreased their originations by 49 percent.
On a year-over-year basis, commercial mortgage originations were up for all classes of lenders. Originations rose 20 percent for the GSEs and 83 percent for depositories. Commercial mortgage originations increased 61 percent for life insurers, 37 percent for CMBS and conduits and 12 percent for investor-driven lenders.
The full report from the MBA includes additional information on lending for other commercial property types. It can be found here.


