

CoStar reported that its value-weighted index of multifamily property prices rose 0.51 percent month-over-month in May, a reversal from last month’s reported decline. This index was up 4.72 percent year-over-year.
By contrast, MSCI Real Capital Analytics reported that multifamily property prices were down 0.4 percent for the month and down 1.1 percent year-over-year in May.
The value-weighted index of non-multifamily commercial property fell 1.41 percent month-over-month in May. This index is down 5.9 percent year-over-year. The other commercial property types tracked by CoStar are office, retail, industrial and hospitality.
For more information on the CoStar Commercial Repeat Sales Indexes (CCRSI’s), please see the description at the bottom of this report.
Multifamily property prices turn higher
The first chart, below, shows the history of the value-weighted CCRSI’s since January 2016 for multifamily property and for all other commercial property considered as a single asset class. It also shows trend lines for the growth in the two CCRSI’s based on their growth in the period from January 2012 to January 2020. The indexes are normalized so that their values in December 2000 are set to 100.
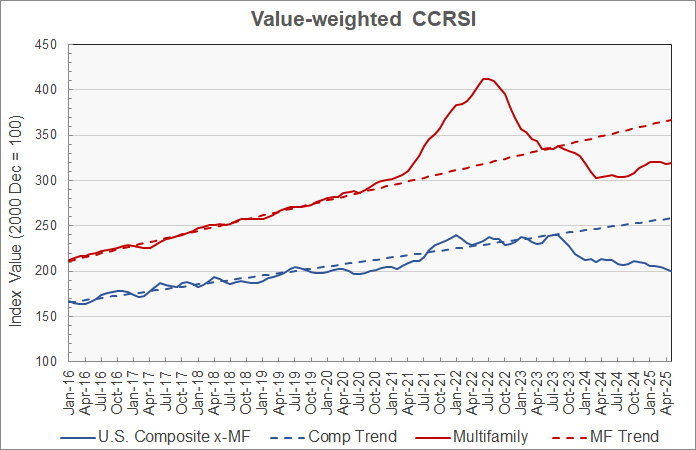
The chart shows that multifamily property prices have been trending higher since March 2024, but the rise has not been uniform. Multifamily property prices are down 22.4 percent from their all-time high. They are 12.9 percent below their pre-pandemic trend.
Prices for other commercial property types fell this month for the third straight month. These prices are now 16.7 percent below their high point and 22.6 percent below their pre-pandemic trend.
The second chart shows the recent history of multifamily property prices and other commercial property prices based on this month’s data along with the estimates from last two month’s reports. For purposes of this chart, the price indexes for both property groupings were each set to a value of 100 in January 2020 so that the indexes could be plotted together at a scale that would show the detailed price movements.
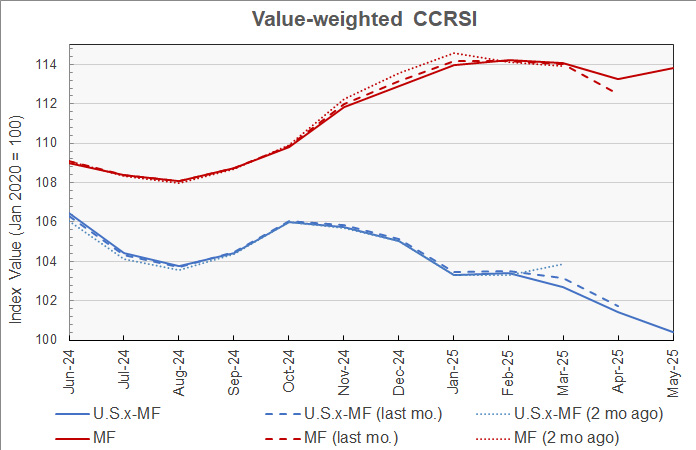
The chart shows that new transactions added to the multifamily data set reduced the size of last month’s reported decline but made almost no difference to the reported CCSRI’s for the two prior months. This month’s revisions to the non-multifamily property price data for March and April lowered the price indexes’ values.
Transaction volumes rise
An issue with monthly transaction volume reporting is that CoStar usually identifies additional transactions to tabulate over the next few months after the initial report, and these extra transactions can change the direction of the apparent price movement. For example, CoStar reported that the transaction volume in May for all property types was down 62 transactions (4.0 percent) from the revised level of the month before, but it was up 133 transactions (9.8 percent) from the preliminary level for April reported last month.
CoStar reported that their initial transaction count for May was 1,491 repeat sales pairs. This is up from the 1,358 transaction pairs identified for April in last month’s report but down from the 1,553 transaction pairs identified for April in this month’s report.
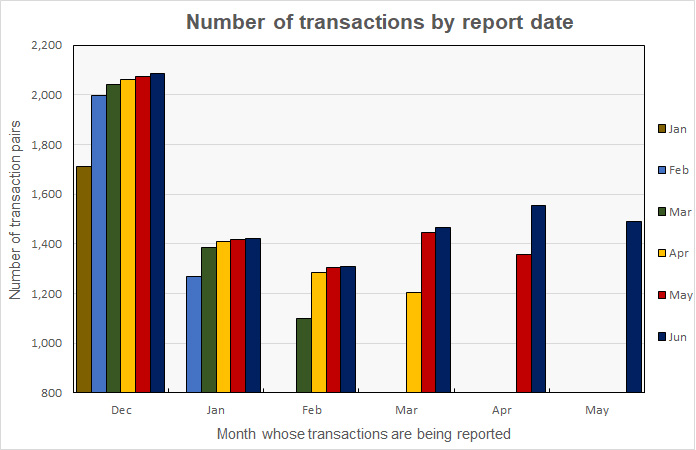
The history of the revisions to the transaction counts for recent months is illustrated in the next chart. It shows that the number of transactions for December was initially given as 1,710 in the January report and has been updated in every subsequent report. While the size of the transaction count revision was largest in the next month’s report, additional transaction pairs for December continued to be identified in every subsequent report. The current report identifies 2,085 transactions for December. By contrast, transaction data for May only appears in the current (June) report and we can expect it to be revised next month.
The preliminary dollar volume of transactions was reported to rise 1.2 percent from the revised level of the month before to $10.17 billion. However, the dollar volume of transactions was reported to be up 10.8 percent from the preliminary level reported last month.
Distress lower
CoStar also reported on the portion of sales that would be considered “distressed”. The next chart shows the distressed sales trends for combined investment grade and commercial grade property sales. Multifamily distressed sales are not separated out from those of other property types in this data. Because of volatility in the data, the chart presents the 3-month weighted moving average of CoStar’s distressed sales data.
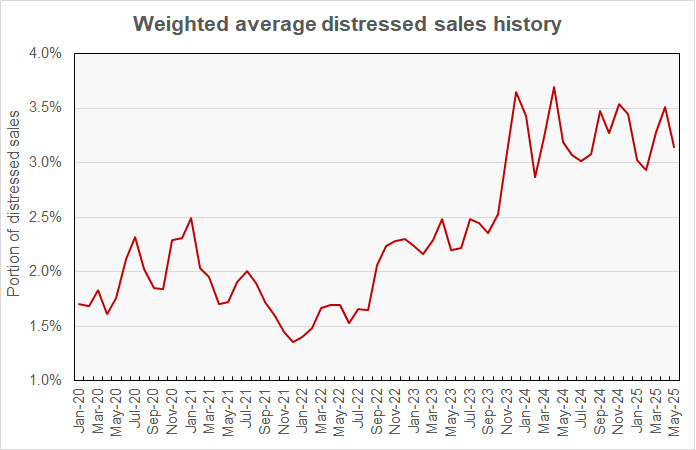
The chart shows that the portion of sales that CoStar designates as distressed reached a low point in late 2021 but then trended higher until late 2023. Since then, it has been running in a range between about 3.0 and 3.5 percent. Since November 2023, distressed sales have averaged 3.29 percent of sales.
The full report discusses all commercial property types. While the CoStar report provides information on transaction volumes, it does not break out multifamily transactions. The latest CoStar report can be found here.
CCRSI defined
The CoStar report focuses on a relative measure of property prices called the CoStar Commercial Repeat Sales Index (CCRSI). The index is computed based on the resale of properties whose earlier sales prices and sales dates are known. The index represents the relative change in the price of property over time rather than its absolute price. CoStar identified 1,491 repeat sale pairs in May for all property types. These sales pairs were used to calculate the results quoted here.
CoStar computes CCRSI’s for a variety of property groupings, combining them by cost, region, property type or other factors. The value-weighted index is more heavily influenced by transactions of expensive properties than is CoStar’s equal-weighted index. The value-weighted index is the focus of this report because it is an index whose value is reported monthly and for which CoStar breaks out multifamily property as a separate category.


