

CoStar reported that its value-weighted index of multifamily property prices was unchanged month-over-month in June. This index was up 4.3 percent year-over-year.
MSCI Real Capital Analytics also recently reported that multifamily property prices were unchanged for the month, but they concluded that prices were up 0.1 percent year-over-year in June.
The value-weighted index of non-multifamily commercial property prices fell 1.0 percent month-over-month in June. This index is down 7.6 percent year-over-year. The other commercial property types tracked by CoStar are office, retail, industrial and hospitality.
For more information on the CoStar Commercial Repeat Sales Indexes (CCRSI’s), please see the description at the bottom of this report.
Multifamily property prices nearly flat
The first chart, below, shows the history of the value-weighted CCRSI’s since January 2016 for multifamily property and for all other commercial property considered as a single asset class. It also shows trend lines for the growth in the two CCRSI’s based on their growth in the period from January 2012 to January 2020. The indexes are normalized so that their values in December 2000 are set to 100.
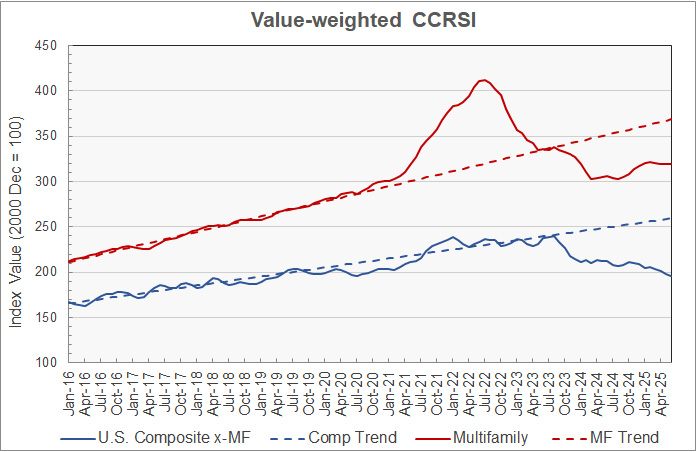
The chart shows that multifamily property prices are well above their 2024 lows but have not had clear direction in recent months.
Multifamily property prices are down 22.6 percent from their 2022 high, but they are 13.5 percent above their level in January 2020. They are also 13.4 percent below their pre-pandemic trend.
Prices for other commercial property types fell this month for the fourth consecutive month. These prices are now 18.3 percent below their high point and 24.4 percent below their pre-pandemic trend.
The second chart shows the recent history of multifamily property prices and other commercial property prices based on this month’s data along with the estimates from the last two month’s reports. For purposes of this chart, the price indexes for both property groupings were set to values of 100 in January 2024 based on the current month’s data so that the indexes could be plotted together at a scale that would show the detailed price movements.
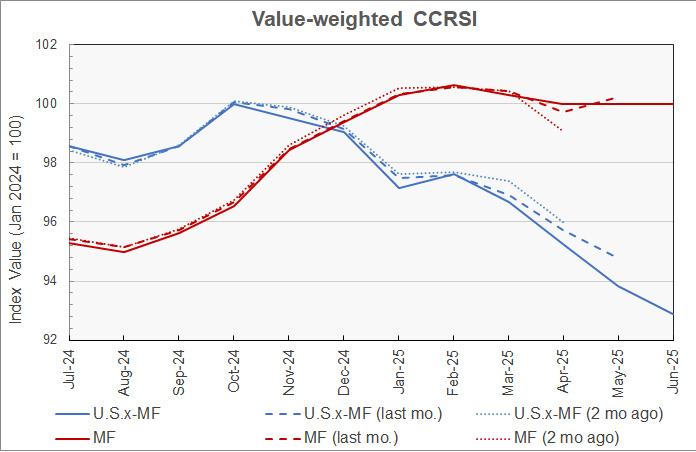
The chart shows that new transactions added to the data sets over the last two months tended to flatten the recent multifamily property price curve. The price index is effectively unchanged over the last 3 months and nearly unchanged for the 3 months before that.
The effect of the new data on the index values for other commercial property was to make recent price movements appear more negative than originally reported. For example, the index for April was first reported as 96.1 but it was revised to 95.7 in the next month’s report and to 95.3 in the latest month’s report.
Tracking regional differences
CoStar’s quarterly reports include information on changes in the equal-weighted CCRSI by property type by region. The history of these regional indexes since Q1 2012 for multifamily property is shown in the next chart, below. For purposes of this chart, the CCRSI’s for each of the four regions was normalized to a value of 100 in Q1 2012.
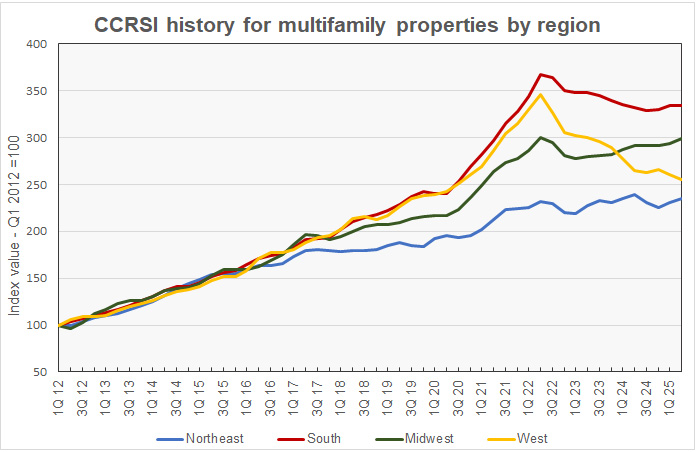
The chart shows that the multifamily property prices in the West have been on a steady downward trend since their post-pandemic peak. Multifamily property prices in the South have also been trending lower since their 2021 peaks, but they have not dropped as much. Prices are now down 26.2 percent from their peak in the West and 9.0 percent in the South. Multifamily property prices in the Northeast are off 1.4 percent from their peak while prices in the Midwest are down only 0.2 percent.
On a quarter-over-quarter basis, multifamily property prices in Q2 2025 were down the most in the West with a drop of 2.1 percent. Prices nearly broke even in the South but fell 0.1 percent. Multifamily property prices rose in the Midwest and Northeast with gains of 1.8 percent in each region.
The next chart shows the history of the year-over-year regional multifamily property price changes by quarter since 2016. The chart shows that multifamily property prices rose in the Midwest and South regions but fell in the Northeast and West regions.
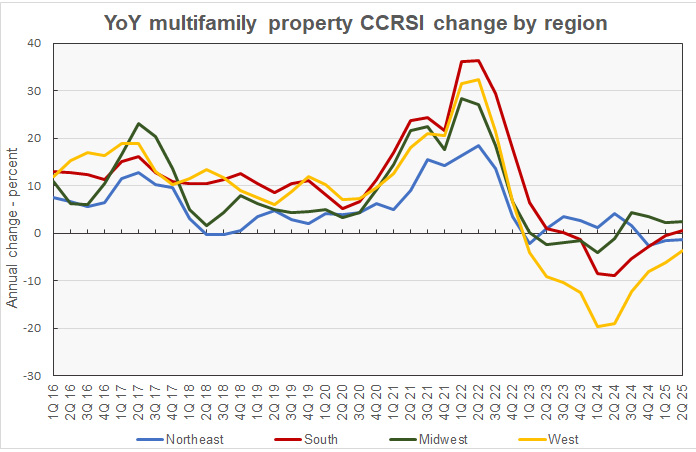
Based on CoStar’s equal-weighted quarterly indexes and compared to year-earlier levels, prices in Q2 2025 were down 3.6 percent in the West and 1.4 percent in the Northeast. Prices rose 0.6 percent in the South and 2.5 percent in the Midwest.
Transaction volumes fall
An issue with monthly transaction volume reporting is that CoStar usually identifies additional transactions to tabulate over the next few months after the initial report, and these extra transactions tend to make initial reports of changes in transaction volumes appear more negative than they will subsequently appear. For example, CoStar reported that the transaction volume in June for all property types was down 242 transactions (15.0 percent) from the revised level of the month before, but it was only down 121 transactions (8.1 percent) from the preliminary level for May reported last month.
CoStar reported that their initial transaction count for June was 1,370 repeat sales pairs. This is down from the 1,491 transaction pairs identified for May in last month’s report and down from the 1,612 transaction pairs identified for May in this month’s report.
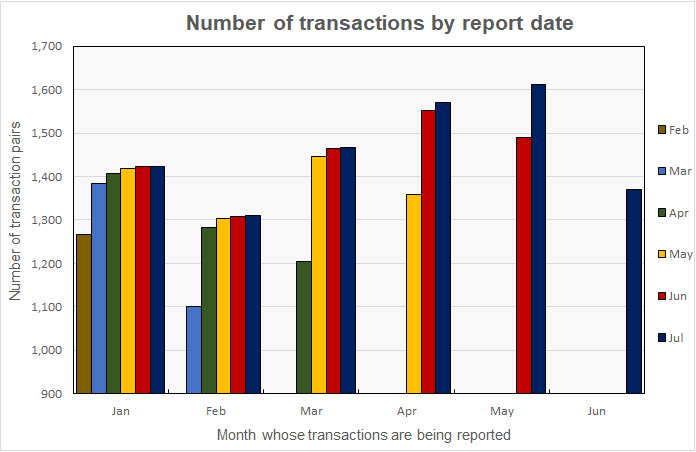
The history of the revisions to the transaction counts for recent months is illustrated in the next chart. It shows that the number of transactions for January was initially given as 1,267 in the February report and has been updated in every subsequent report. While the size of the transaction count revision was largest in the next month’s report, additional transaction pairs for January continued to be identified in every subsequent report. The current report identifies 1,423 transactions for January. By contrast, transaction data for June only appears in the current (July) report and we can expect it to be revised next month.
The preliminary dollar volume of transactions was reported to fall 8.3 percent from the revised level of the month before to $9.78 billion. However, the dollar volume of transactions is only 3.9 percent below the preliminary level reported last month.
The full report discusses all commercial property types. While the CoStar report provides information on transaction volumes, it does not break out multifamily transactions. The latest CoStar report can be found here.
CCRSI defined
The CoStar report focuses on a relative measure of property prices called the CoStar Commercial Repeat Sales Index (CCRSI). The index is computed based on the resale of properties whose earlier sales prices and sales dates are known. The index represents the relative change in the price of property over time rather than its absolute price. CoStar identified 1,370 repeat sale pairs in June for all property types. These sales pairs were used to calculate the results quoted here.
CoStar computes CCRSI’s for a variety of property groupings, combining them by cost, region, property type or other factors. The value-weighted index is more heavily influenced by transactions of expensive properties than is CoStar’s equal-weighted index. The value-weighted index is the focus of this report because it is an index whose value is reported monthly and for which CoStar breaks out multifamily property as a separate category.


