

The latest commercial property price report from MSCI Real Capital Analytics said that multifamily property prices were unchanged in June compared to the revised level of the month before. Prices were up 0.1 percent year-over-year.
Defining CPPI
MSCI tracks an index called the Commercial Property Price Index (CPPI). The index is computed based on the resale prices of properties whose earlier sales prices and sales dates are known. The index represents the relative change in the price of property over time rather than its absolute price. Note that, as new property transactions are added to the MSCI dataset each month, they recalculate the CPPI for the months in which the transactions occurred, potentially all the way back to the beginning of the data series.
Multifamily property prices flat
The first chart, below, shows how the CPPI’s for all commercial property as a single asset class and for apartments have changed since January 2016. Both CPPI’s have been normalized to values of 100 in January 2012. The chart also contains trend lines showing the straight-line average rates of price appreciation for the two asset classes based on their performances from January 2012 to December 2019, a period in which property price appreciation was remarkably steady.
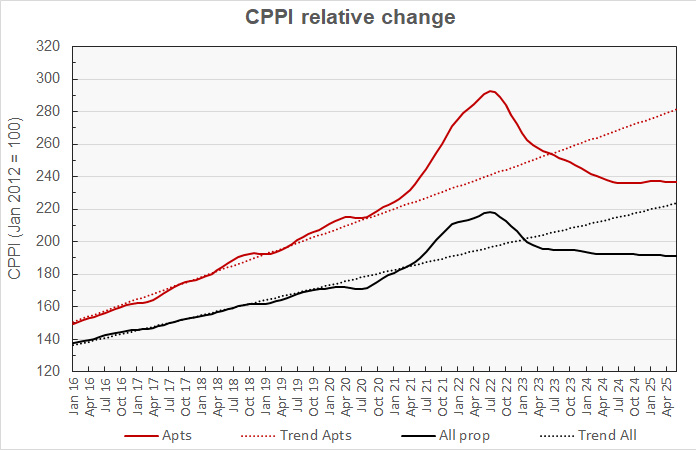
The chart shows that both multifamily property prices and general commercial property prices have been nearly flat over the last year with both price indexes within 1 percent of their year-ago levels. The year-over-year multifamily property price index rise this month, although less than 0.1 percent, is the first positive reading since December 2022.
Multifamily property prices are now down 19.0 percent from their peak but are 12.4 percent above their level in January 2020. They are 16.2 percent below their pre-pandemic trend line.
Prices for all commercial property as a single asset class were down 0.2 percent month-over-month in June and were down 1.0 percent year-over-year. They are now 12.7 percent below their peak but are 11.0 percent above their level in January 2020. They are 15.8 percent below their pre-pandemic trend.
The next chart plots the month-over-month changes in the values of the CPPI over the last 13 months for all commercial property as a single asset class and for apartments. It also includes the same metrics based on the data included in last month’s report and the report from the month before that.
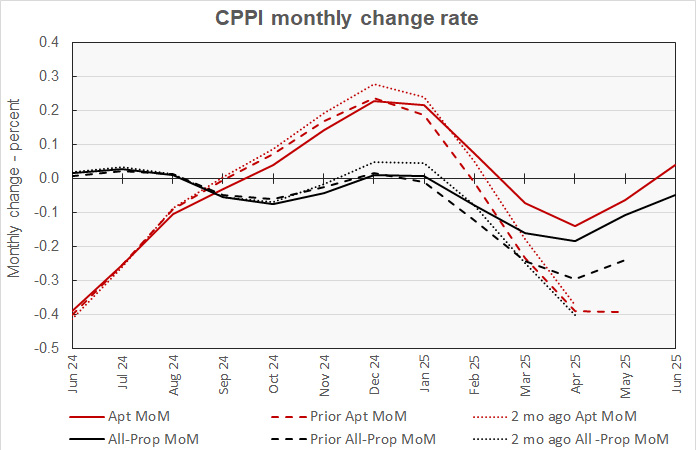
The chart shows that transactions added to the dataset over the last two months have made the month-over-month multifamily property price changes in transactions which took place last year slightly worse. However, the month-over-month price changes for transactions since February are more positive after the revisions in the latest report. For example, the month-over-month change in the multifamily price index for April transactions was reported to be -0.37 percent two months ago. It was revised to -0.39 percent in last month’s report and to -0.14 percent in the latest report.
The chart also shows that the pattern of revisions to the month-over-month pricing data for all commercial property considered as a single asset class followed a similar pattern. Revisions to the data for last year lowered the property price growth rates. However, property prices changes for transactions taking place in March through May in the current report are less negative than the month-over-month price changes listed this month’s report.
Other property prices mixed in June
In June, MSCI found that prices fell for offices in both the suburbs and in central business districts (CBDs). Prices for retail property were unchanged while prices for industrial property moved higher. The CPPI for suburban offices fell 0.6 percent for the month while the CPPI for offices in CBDs fell 0.1 percent. Industrial property prices rose by 0.3 percent.
Retail property prices again rose by the greatest amount on a year-over-year basis with a 3.5 percent increase. Industrial property prices were up 1.6 percent. Prices fell 2.1 percent for suburban offices, while prices fell 4.2 percent for offices in CBDs.
Non-major metro commercial property prices higher
The MSCI report provides data comparing the price changes of commercial property in 6 major metro* areas against those in the rest of the country, although it does not separate apartments from other commercial property types in this comparison. The next chart, below, plots the history of the relative price indexes since January 2016 for both market segments, along with trend lines based on straight-line fits to the changes in these indexes between January 2012 and December 2019. For purposes of this chart, both price indexes were set to values of 100 for January 2012.
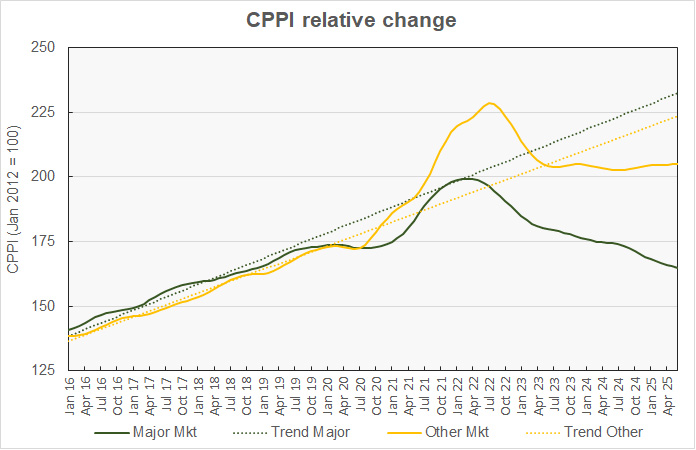
The chart shows that the CPPI for major metro commercial property has been falling since March 2022. In the latest report, major metro property prices are down 0.3 percent month-over-month and 5.4 percent year-over-year. They are down 17.2 percent from their peak and are now 4.9 percent below their level in January 2020. They are 29.1 percent below their long-term trend.
The latest data shows that month-over-month changes in the CPPI for non-major markets have been positive for 11 consecutive months. Year-over-year changes have been positive for 5 consecutive months. The non-major metro CPPI is up 0.1 percent month-over-month and up 1.1 percent year-over-year. It is down 10.2 percent from its peak but is 18.6 percent above its level in January 2020. The non-major metro CPPI is 8.3 percent below its pre-pandemic trend.
The final chart plots the history of the month-over-month changes in the price indexes for the two property market segments over the last 13 months along with the monthly price change data from the last two reports.
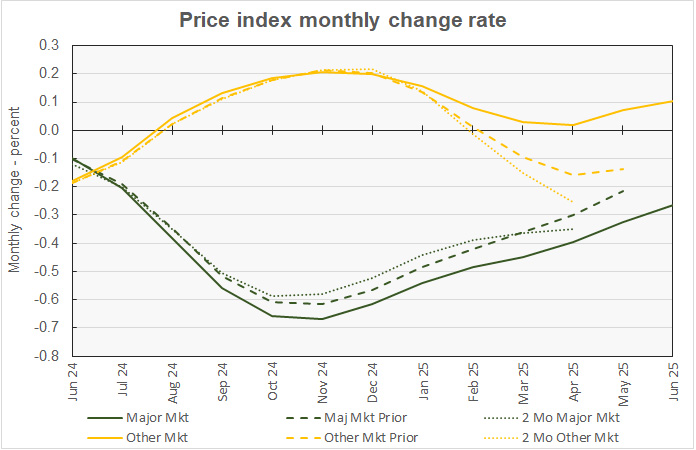
The chart shows that the latest data reveals smaller pricing declines or actual price gains for transactions occurring in recent months for non-major metros than was reported last month. However, the newest CPPI data for the major metro markets shows larger price declines than had been shown in last month’s data.
The major metro month-over-month price drop for April was initially reported to be 0.35 percent, but it was revised to a decline of 0.30 percent last month and to a fall of 0.40 percent this month. The non-major metro month-over-month price drop for April was initially reported to be 0.25 percent, but it was revised to a decline of 0.16 percent last month and to a gain of 0.02 percent this month.
The full report provides more detail on other commercial property types. Access to the MSCI Real Capital Analytics report can be obtained here.
*The major metros are Boston, Chicago, Los Angeles, New York, San Francisco and Washington DC.


