

The latest rent report from Apartment List shows that the national median monthly rent growth in July was 0.03 percent. Rents have now risen for 6 months in a row, but the rate of growth is declining and is flirting with going negative. Year-over-year rent growth remains negative at -0.84 percent.
Apartment List reported the national median apartment rent to be $1,402, up $1 from last month’s figure. The national median rent is lower than it was in May 2022 when it was $1,403.
Charting the data
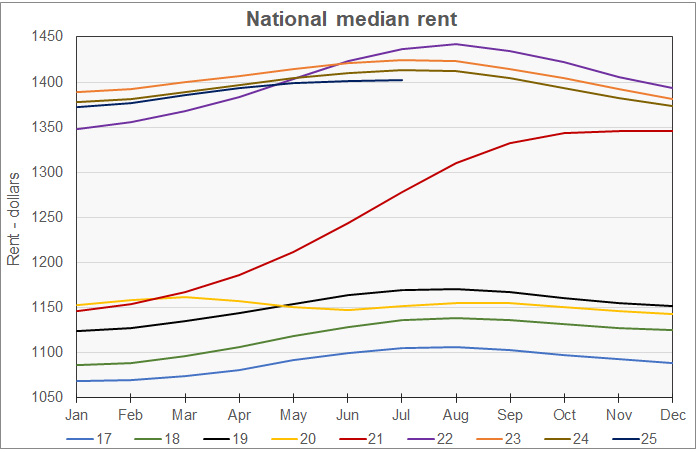
The first chart shows the history of the national median rent level since 2017. It is plotted year-by-year so that the annual change pattern is visible. The chart shows that rents in March 2025 looked like they were about to exceed those in 2024. However, since March, rents in 2025 have been falling farther behind those of the year before.
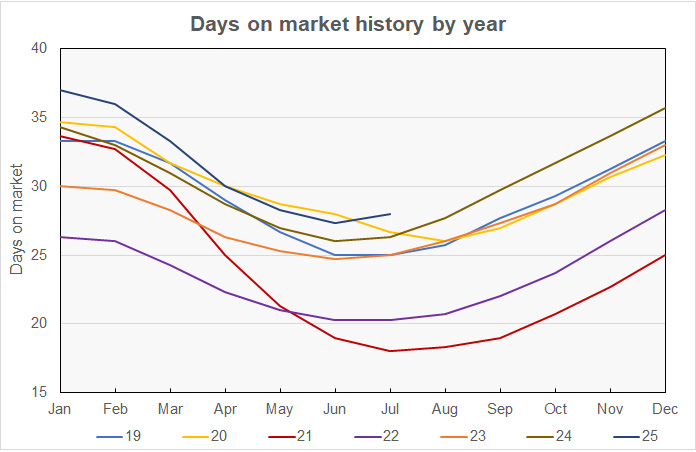
The next chart shows the national average number of days a unit listed on Apartment List stayed on the market until it was leased. The chart shows that days-on-market (DOM) turned higher in July. This is not uncommon as this also occurred in 2019, 2022, 2023 and 2024. However, the increase in DOM in July 2025 was 0.7 days, while no other year saw an upturn of more than 0.3 days. The DOM reading of 28 days in July 2025 is the highest of any July in the Apartment List dataset.
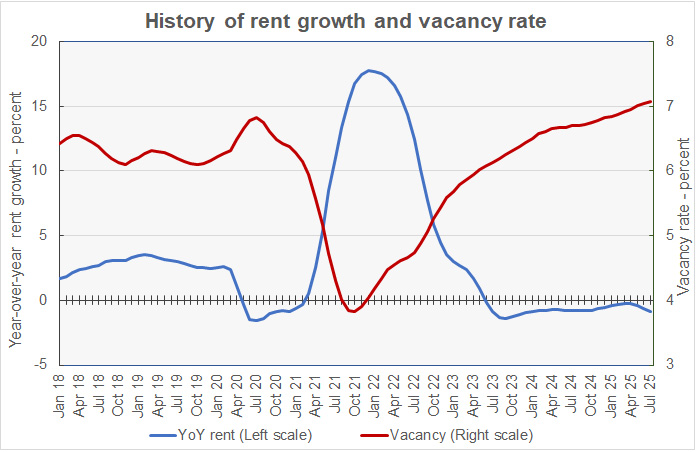
The next chart shows the year-over-year rate of rent growth since January 2018 plotted along with the national median apartment vacancy rate. The chart shows that the national average vacancy rate edged higher again this month. Its reading of 7.1 percent is a new record high for the Apartment List dataset. The chart also shows that year-over-year rent growth, which was on the cusp of going positive last March, has been turning increasingly negative since then.
The final chart shows the change in the national median apartment rent since January 2017 in nominal dollar terms along with two other measures of rent accounting for changes in income and price levels. The Income adjusted curve adjusts the rent by the change in average hourly earnings of all employees as reported by the Bureau of Labor Statistics. The Inflation adjusted curve adjusts the rent by the general change in price level as measured by the not-seasonally-adjusted Consumer Price Index for all urban consumers (CPI-U).
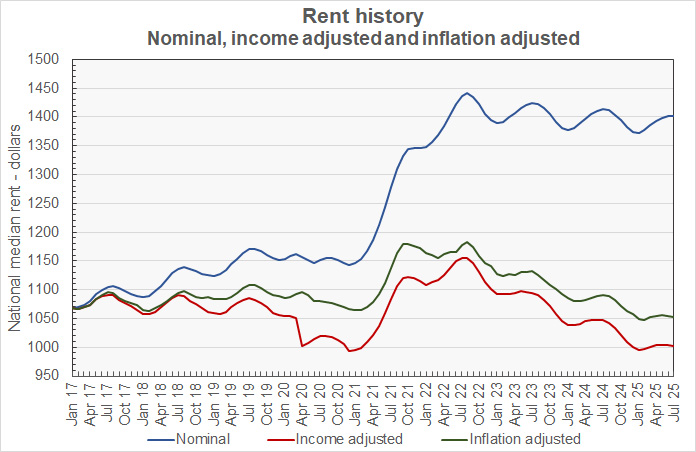
The curves show that, when adjusted for wage growth or for the general increases in prices, rents are below their pre-pandemic levels. Since January 2017, average rents are up 31.2 percent while average hourly earnings are up 39.8 percent and inflation as measured by the CPI-U is up 33.3 percent.
Ranking the metros
Apartment List provides the underlying data they collected in compiling their report and that data was used to create the tables, below. The tables look at the 50 most populous metropolitan statistical areas defined by the US Census Bureau and identify the top and bottom 10 metros for year-over-year rent growth. The tables provide the median monthly rent in the metro, the percentage change from the prior month’s rent level (MoM Metro), the annual percentage change in rent (YoY Metro) and the metro’s vacancy rate. They also list the days on market (DOM) metric, although this data is not available for all metro areas.
The first table shows the 10 metros with the largest annual percentage increases in rents.
| Metro | Metro Rent | MoM Metro | YoY Metro | Vacancy rate | DOM |
| San Francisco | $2,670 | 0.30 | 4.6 | 4.8 | 25.2 |
| Chicago | $1,700 | 0.18 | 4.0 | 5.4 | 25.7 |
| Virginia Beach | $1,619 | 0.43 | 2.8 | 5.4 | 19.3 |
| Minneapolis | $1,509 | 0.34 | 2.8 | 7.1 | 32.3 |
| Pittsburgh | $1,235 | 0.55 | 2.6 | 6.5 | 27.7 |
| Richmond | $1,478 | 0.42 | 2.5 | 6.7 | N/A |
| San Jose | $3,077 | 0.52 | 2.4 | 5.4 | 26.3 |
| Providence | $1,494 | (0.22) | 2.2 | 4.6 | N/A |
| Hartford | $1,605 | 0.35 | 2.2 | 3.7 | 26.0 |
| New York | $2,303 | 0.49 | 2.1 | 4.9 | 28.3 |
The next table shows the 10 metros with the smallest annual rent increases.
| Metro | Metro Rent | MoM Metro | YoY Metro | Vacancy rate | DOM |
| Austin | $1,344 | (0.39) | (6.8) | 10.0 | 36.7 |
| Denver | $1,716 | (0.18) | (5.0) | 8.5 | 30.3 |
| Phoenix | $1,390 | (0.41) | (4.1) | 8.3 | 30.8 |
| San Antonio | $1,212 | 0.13 | (3.1) | 9.2 | 36.7 |
| Salt Lake City | $1,475 | 0.06 | (2.4) | 8.6 | 32.3 |
| Raleigh | $1,422 | 0.04 | (2.3) | 8.4 | 32.3 |
| New Orleans | $1,214 | 0.76 | (2.2) | 5.0 | N/A |
| Dallas | $1,449 | (0.05) | (2.2) | 8.7 | 32.7 |
| Orlando | $1,554 | 0.02 | (1.8) | 7.5 | 26.0 |
| Charlotte | $1,348 | (0.07) | (1.8) | 8.8 | 32.3 |
In July, 25 of the 50 most populous metros saw their rents rise on a year-over-year basis. In addition, 34 of the 50 most populous metros saw rents rise on a month-over-month basis.
The complete Apartment List report covers many more metros and also provides city, county and state data. It gives readers with the opportunity to download their data sets. The latest report can be found here.


