

The Census Bureau’s quarterly report on home ownership and occupancy for Q2 2025 stated that the rental housing vacancy rate was 7.0 percent, down 0.1 percentage points since last quarter’s report. This was the highest Q2 vacancy rate reading since 2017.
Vacancies rate steps back
The headline vacancy rate reported by Census is for all rental housing in the country, both single-family and multifamily. Census breaks down this figure in various ways, including by the number of units in the building. The chart, below, illustrates this comparison.
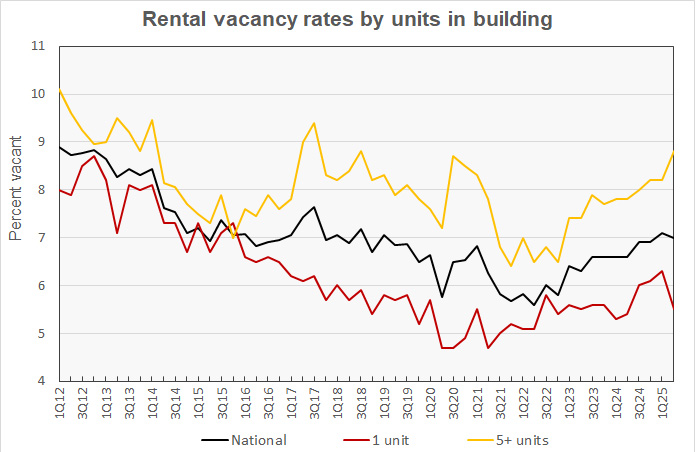
The chart shows that the national housing vacancy rate has generally been moving higher since early 2022 but not uniformly. The slight decrease in the reported vacancy rate for Q2 is consistent with other decreases which occurred in the course of the rise. It should also be noted that the Census Bureau reported that the margin of error on their vacancy rate measurement was 0.2 percentage points, so the reported decrease may just be measurement error.
The vacancy rate for single-family housing has consistently been lower than that for multifamily housing with 5+ units per building and that trend was amplified this quarter. In Q2, vacancies for multifamily housing with 5+ units per building as measured by the Census Bureau rose 0.6 percentage points to 8.8 percent. At the same time, the single-family rental vacancy fell 0.8 percentage points to 5.5 percent. One year ago, the single-family vacancy rate measured by the Census Bureau was 5.4 percent.
Note that Apartment List reported that the multifamily rental vacancy rate at the end of June was 7.0 percent. By contrast, Yardi Matrix reported the multifamily rental vacancy rate in June as 5.4 percent. While the Census Bureau attempts to capture data representing all rental housing in the country, other data sources may focus on subsets of the market like professionally managed, stabilized properties and so they come up with different results.
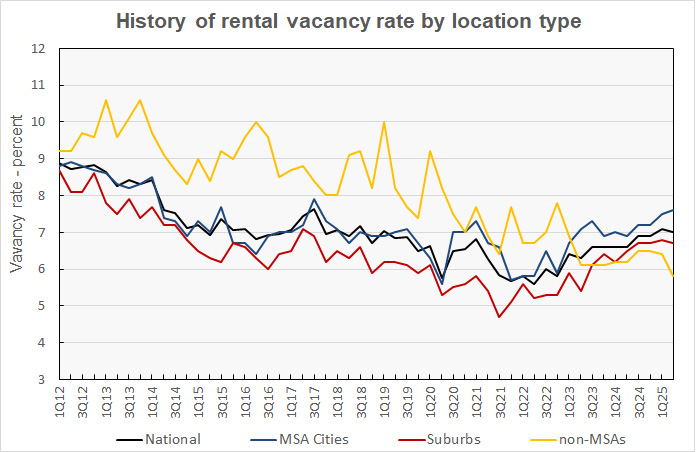
The Census Bureau reported that the rental vacancy rate in the core cities of the Census Bureau’s Metropolitan Statistical Areas (MSAs) was 7.6 percent in Q2 2025, this is up 0.1 percentage point from the value reported last quarter and up 0.7 percentage points from the level in the same quarter last year. The rental vacancy rate in the suburbs of the MSAs was 6.7 percent in Q2 2025, down 0.1 percentage point. These trends are shown in the next chart, below.
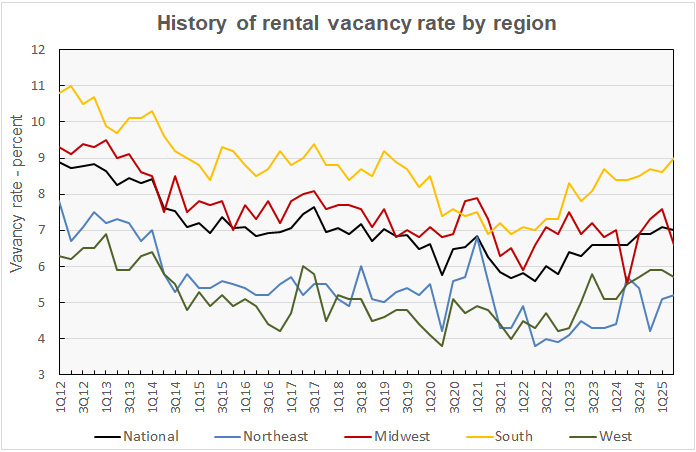
The rental vacancy rate history for each of the Census regions is shown in the next chart, below. The reported vacancy rate edged higher in the Northeast, rising 0.1 percentage points to 5.2 percent. The vacancy rate was reported to fall 1 full percentage point to 6.6 percent in the Midwest. The reported vacancy rate rose 0.4 percentage point in the South to 9.0 percent. It fell 0.2 percentage points in the West to 5.7 percent.
Census reported that 61.7 percent of vacant rental units were in structures with 2 or more units. About 23.7 percent of the vacant rental units had 3 or more bedrooms, with one-bedroom units comprising 33.7 percent and two-bedroom units comprising 40.2 percent of vacant stock. The median unit vacancy duration for rental properties in Q2 2025 was 2.8 months, unchanged from the duration one year earlier.
Rentership rate moves higher
The Census Bureau reported that 35.0 percent of the country’s 132,514,000 occupied housing units were inhabited by renter households in Q2 2025. This rate is up 0.2 percentage points from that in Q1 and is at its highest level since the end of 2019.
The history of the number of occupied housing units and the share of renter households since 2012 is shown in the next chart, below. The chart shows that the reported number of renter households rose by 206,000 in the quarter and was up by 1,232,000 since Q2 2024. There were 46,355,000 renter households identified in Q2 2025.
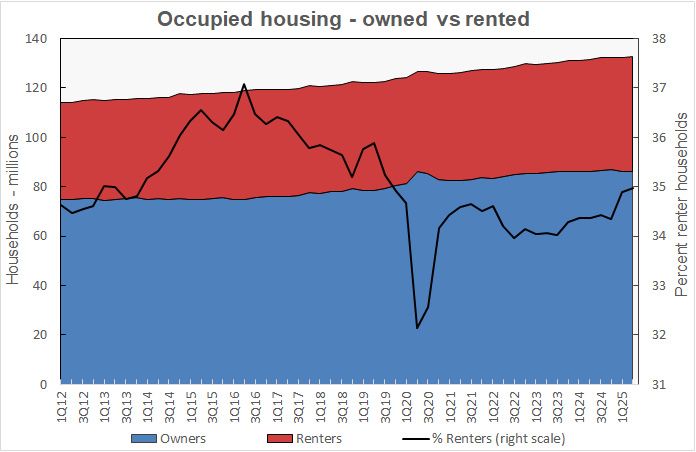
The number of homeowning households rose by 73,000 in the quarter to 86,159,000 households. However, the number of homeowning households was down 39,000 from Q2 2024.
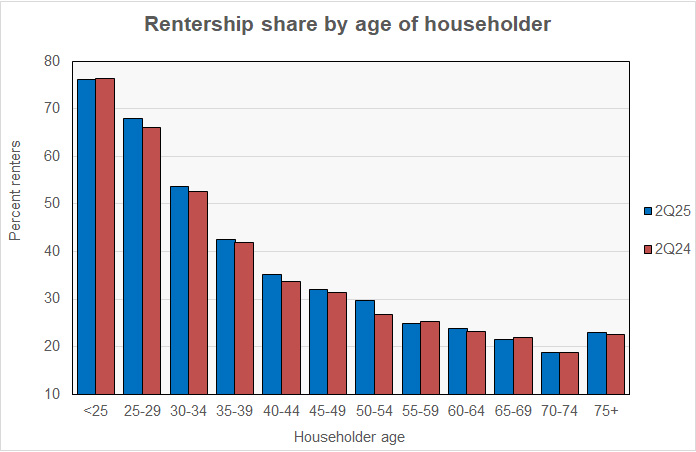
The Census Bureau also reported on the rentership rate by the age of the head of household. The results for Q2 2025 and for Q2 2024 are illustrated in the next chart. It shows that the share of renter households rose for most age groups, with only 3 age groups showing a decline.
Census reports rents rise
The Census Bureau also tracks the median asking rents for the country as-a-whole. The history of their findings along with the year-over-year rent growth rate is shown in the next chart, below.
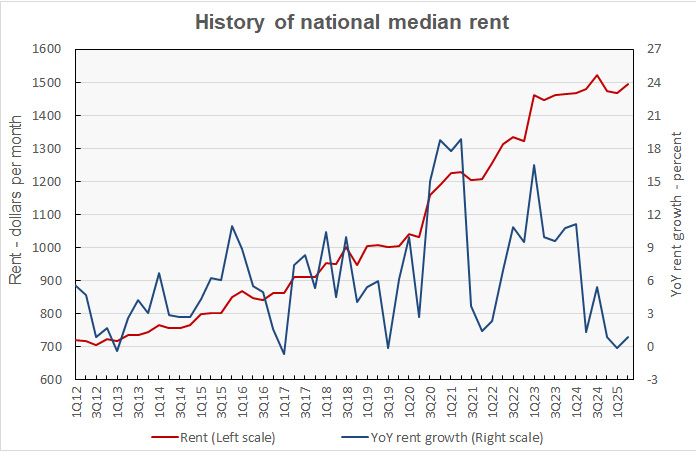
Census reported that monthly rents rose $26 per month in Q2 2025, the first rise after 2 quarters of decline. Census reported the national median rent to be $1,494 per month, a rise of 1.8 percent from the prior quarter and a rise of 0.9 percent year-over-year. This figure is the median value encompassing both single-family and multifamily rentals.
By contrast, Yardi Matrix reported that the national average apartment rent in June was $1,749 per month. Apartment List reported the national average apartment rent in June was $1,401 per month.
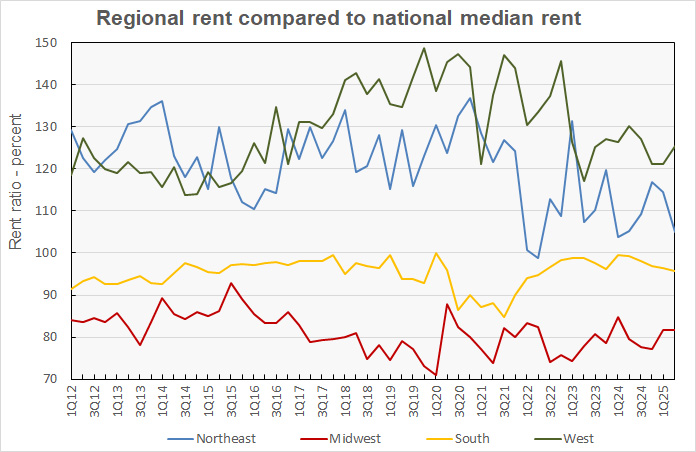
The last chart, below, shows the history of the median rent by Census region as a percentage of the national median rent. Rents were 5.1 percent higher than the national median in the Northeast, and 25.5 percent higher in the West. Rents were reported to be 18.3 percent lower than the national median in the Midwest and 4.2 percent lower in the South.
The Census report is called Quarterly Residential Vacancies and Homeownership, Second Quarter 2025. It is available here.


