

Yardi Matrix reported that the national average asking apartment rent was up $3 in June compared to the revised level of the month before at $1,749 per month. The national average year-over-year asking apartment rent growth was +0.9 percent, down 0.1 percentage points from the rate reported last month. The month-over-month rent growth rate was 0.2 percent.
Rents in the “lifestyle” asset class, usually Class A properties, were unchanged year-over-year. Rents in “renter by necessity” (RBN) properties increased by 1.7 percent year-over-year. The lifestyle rent growth is down 0.2 percentage points from last month’s reported rate while the RBN rent growth is down 0.1 percentage points. The following chart shows the history of the year-over-year rent growth rates for these two asset classes along with the difference between these rates.
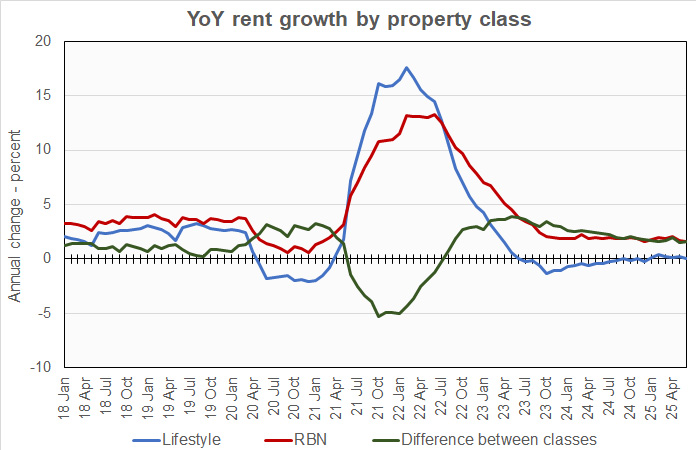
The metrics illustrated in the chart have been relatively stable in 2025. Rent growth for lifestyle properties has averaged 0.2 percent year-over-year while that for RBN properties has averaged 1.9 percent. These figures compare to lifestyle rent growth averaging 2.2 percent in 2018, with RBN growth averaging 3.4 percent. RBN rent growth outpaced that of lifestyle properties by 1.2 percentage points in 2018. The difference between the rates increased to 1.7 percentage points in the first 6 months of 2025.
Yardi Matrix reported that the U.S. average occupancy rate in May was unchanged from the revised level of the month before at 94.6 percent. This is up 0.2 percentage points from the level listed in last month’s report. The occupancy rate is down 0.2 percentage points year-over-year despite 250,000 units being absorbed in the first 6 months of the year.
Renter burden rises
The discussion section of this month’s report discussed the Harvard Joint Center for Housing Studies recent report on the nation’s housing, a topic that was covered at greater length at yieldpro.com.
The Yardi Matrix discussion focused on the rapid increase in rents which has taken place over the last 5 years, but it does not place this in the context of the rapid rise in income that has occurred over the same period. It does look at the wide variation in city-by-city results that have been experienced, both in absolute dollar increases and also in relative increases. While the national average rent increased 25 percent, some cities saw increases at twice that rate. While the national average rent increased by $350, rents in New York City rose $1,100 and other cities saw increases of $700 or more.
The Yardi Matrix report also listed cities where rents have fallen since 2023. Austin was in the lead with rents down $196 or 11.2 percent. Other cities with significant drops in rents include Phoenix, Orlando and Raleigh-Durham.
Tabulating the data
Yardi Matrix reports on other key rental market metrics in addition to rent growth. These include the year-over-year job growth rate based on the 6-month moving average and the completions over the prior 12 months as a percentage of existing stock. The 10 metros with the largest annual apartment rent increases are listed in the table below, along with the other data.
| City | YoY rent | YoY rent last month |
YoY jobs (6 mo moving avg) |
Completions as % of stock |
| Chicago | 3.6 | 3.1 | 0.4 | 1.6 |
| Columbus | 3.3 | 3.3 | 0.8 | 2.8 |
| Kansas City | 3.2 | 4.0 | 0.4 | 2.3 |
| New York | 3.1 | 5.7 | 1.6 | 2.3 |
| Detroit | 2.9 | 3.1 | 0.5 | 0.8 |
| Indianapolis | 2.4 | 2.8 | 0.7 | 3.1 |
| Twin Cities | 2.4 | 2.7 | 0.8 | 3.8 |
| New Jersey | 2.3 | 3.0 | 1.3 | 3.4 |
| San Francisco | 2.2 | 1.6 | (0.5) | 2.4 |
| Philadelphia | 2.0 | 3.4 | 1.1 | 1.5 |
The major metros with the smallest year-over-year apartment rent growth as determined by Yardi Matrix are listed in the next table, below, along with the other data as in the table above.
| City | YoY rent | YoY rent last month |
YoY jobs (6 mo moving avg) |
Completions as % of stock |
| Austin | (4.7) | (5.2) | 1.6 | 9.6 |
| Denver | (3.9) | (3.5) | 0.2 | 6.3 |
| Phoenix | (2.6) | (3.4) | 0.3 | 5.2 |
| Dallas | (1.2) | (1.5) | 1.2 | 4.1 |
| Orlando | (1.2) | (1.8) | 2.0 | 5.6 |
| Las Vegas | (1.1) | (1.0) | 0.4 | 3.2 |
| Nashville | (1.0) | (1.0) | 0.8 | 6.5 |
| San Diego | (0.9) | (0.4) | 0.5 | 2.1 |
| Atlanta | (0.8) | (1.0) | 0.8 | 3.6 |
| Portland | (0.7) | 0.5 | 0.1 | 3.6 |
The top metros for month-over month rent growth in June were Chicago, Boston, Columbus and San Francisco, none of which was in the top 4 in last month’s report. The trailing metros this month were Austin, Phoenix, Tampa and Miami. Of these, both Phoenix and Tampa were in the bottom 4 in last month’s report.
Single-family rentals rents rise modestly
Yardi Matrix also reported that single-family rental build-to-rent (SFR) rents rose $4 in June from the revised level of the month before to $2,201 per month. SFR rents were up 0.7 percent year-over-year.
Yardi Matrix reported on the top 34 markets for built-to-rent single-family rentals, 21 of which saw rents grow year-over-year in June. The leading markets for year-over-year rent growth were Chicago, Kansas City, Inland Empire and Harrisburg.
The markets with the lowest year-over-year rent growth were Raleigh, Austin, Tampa and Cleveland.
The national occupancy rate for single-family rentals was 94.9 percent, up 0.1 percentage points from the level reported last month. The national occupancy rate was down 0.5 percent year-over-year.
This month, 15 of the metros saw year-over-year occupancy increases. The metros with the largest year-over-year occupancy increases were Jacksonville, Atlanta, Indianapolis and Inland Empire. The metros with the greatest occupancy declines were Pensacola, Las Vegas, Harrisburg and Denver.
The complete Yardi Matrix report provides information on some of the smaller multifamily housing markets and more information on the differences in results between lifestyle and RBN properties. It can be found here.


