

A report from the Mortgage Bankers’ Association (MBA) says that multifamily mortgage originations were down 35 percent year-over-year in Q2. This was the largest decline for the property types the MBA tracks, although hotel originations came in a close second. Originations of all commercial mortgages as a single asset class rose 66 percent year-over-year.
Overall commercial mortgage originations higher
The first chart, below, shows the MBA’s quarterly origination volume indexes since Q1 2016 both for all commercial mortgages as a single asset class and for multifamily mortgages. The indexes are reported relative to the year 2001, with the average quarterly volume in that year defined as a value of 100.
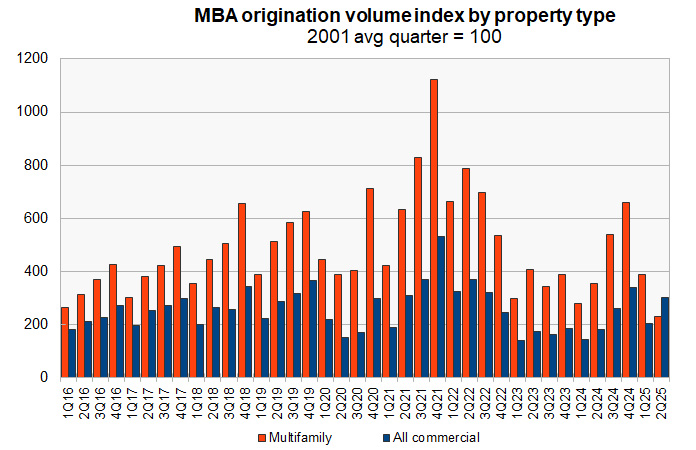
The usual pre-pandemic pattern of mortgage origination volume was for origination volume to increase quarter-by-quarter through the year with Q1 mortgage origination volume declining from the level in Q4 of the previous year. The origination volume each quarter would be higher than that of the same quarter of the previous year. The average multifamily origination volume increase from Q1 to Q2 for the period from 2016 to 2019 was 25 percent while the average year-over-year increase in Q2 was 13 percent.
Origination volume for multifamily mortgages in Q2 deviated significantly from the pre-pandemic pattern in that the volume of originations was down 41 percent from the level in Q1. The multifamily origination volume index came in at its lowest level for a Q2 since at least 2014.
The report covers originations for 5 other commercial property categories. They are office, retail, industrial, hotel and health care.
Mortgage originations for office property surged 140 percent year-over-year but fell 18 percent quarter-over-quarter. Retail property originations rose 30 percent year-over-year and 58 percent quarter-over-quarter. Industrial mortgage originations rose 53 percent year-over-year and 102 percent quarter-over-quarter. Hotel originations fell 30 percent year-over-year but were unchanged quarter-over-quarter. Health care originations rose 77 percent year-over-year and 90 percent quarter-over-quarter.
Overall commercial property mortgage originations were up 48 percent quarter-over-quarter, well above the pre-pandemic Q2 average of 26 percent.
Who’s lending?
The MBA report also includes data on the sources of the commercial mortgages being originated. However, this section of the report does not break out multifamily mortgages from lending on other types of commercial real estate.
The report provides data on five categories of lenders: commercial mortgage-backed securities (CMBS) and conduits, depositories (aka commercial banks and savings and loans), life insurance companies, the government sponsored entities (GSEs), Fannie Mae and Freddie Mac, and investor-driven lenders such as REITs and specialty finance companies. The index values are quoted relative to the average quarterly origination volumes in the year 2001. The index values of different originators cannot be used to compare their absolute levels of mortgage originations since their origination levels in the baseline year of 2001 were different.
To gain insight into the absolute levels of funding provided by the different classes of originators, readers should look to the MBA’s report on mortgage debt outstanding, which also takes dispositions into account. However, the origination index values can be compared to see which classes of originators are actively lending today and which are not.
The final chart shows the history of commercial mortgage origination volume indexes since Q1 2017 by class of lender. It shows that the pattern of commercial mortgage origination volumes rising from Q1 to Q2 was maintained this year for all of the lender types except for CMBS and conduits.
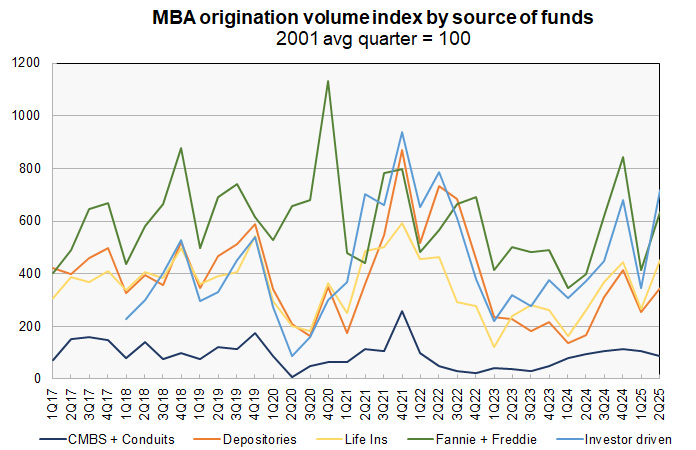
The GSEs, who held 49.6 percent of multifamily mortgages as of Q1, saw their originations rise by 54 percent quarter-over-quarter. Depositories, who hold 29.6 percent of multifamily mortgages, increased their originations 36 percent quarter-over-quarter. Life insurers, who hold 11.2 percent of multifamily mortgages, increased their originations by 79 percent compared to Q1. CMBS and conduits, who held 2.9 percent of multifamily mortgages, decreased their originations by 20 percent quarter-over-quarter while investor-driven lenders increased their originations by 107 percent.
On a year-over-year basis, commercial mortgage originations were also up for all classes of lenders except CMBS and conduits. Originations rose 59 percent for the GSEs and 107 percent for depositories. Commercial mortgage originations increased 72 percent for life insurers and 93 percent for investor-driven lenders. Originations fell 10 percent year-over-year for CMBS and conduits.
The full report from the MBA includes additional information on lending for other commercial property types. It can be found here.


