

Yardi Matrix reported that the national average asking apartment rent was up $2 in July compared to the revised level of the month before at $1,754 per month. The national average year-over-year asking apartment rent growth was +0.7 percent, down 0.2 percentage points from the rate reported last month. The month-over-month rent growth rate was 0.1 percent.
Rents in the “lifestyle” asset class, usually Class A properties, were up 0.3 percent year-over-year. Rents in “renter by necessity” (RBN) properties increased by 1.5 percent year-over-year. The lifestyle rent growth is up 0.3 percentage points from last month’s reported rate while the RBN rent growth is down 0.2 percentage points. The following chart shows the history of the year-over-year rent growth rates for these two asset classes along with the difference between these rates.
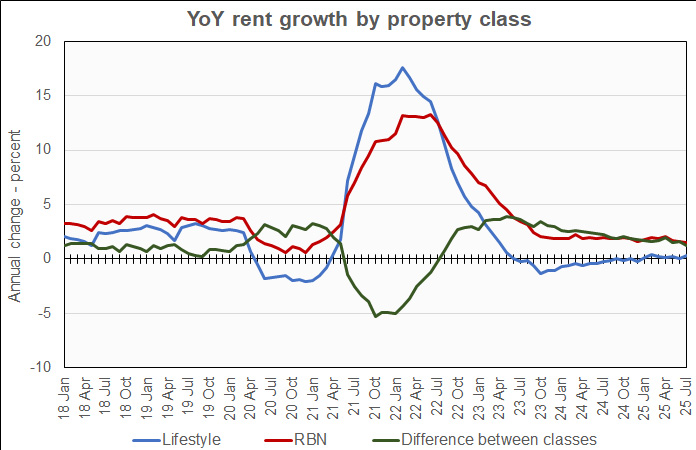
The chart shows that the year-over-year rent growth rates of the two property classes have been slowly converging since January 2024. This month’s difference between the rates is the smallest it has been since August 2022 and, at 1.2 percent, it is close to the 1.0 percent average difference that prevailed in 2018 through 2019. However, the rent growth rates for the two property classes are well below the levels seen then.
Yardi Matrix reported that the U.S. average occupancy rate in June was unchanged from the revised level of the month before at 94.7 percent. This is up 0.1 percentage points from the level listed in last month’s report. The occupancy rate is down 0.1 percentage point year-over-year.
Expense growth slows
The discussion section of this month’s report focuses on the slowdown in expense growth at multifamily properties this year after several years of rapidly climbing expenses. A major reason for this slowdown is that insurance cost increases have slowed. Insurance providers have evidently now increased their rates to a level sufficient to allow them to rebuild their reserves after large losses in recent years.
While the general rate of expense growth has slowed, the report notes that the rates of expense growth are different for different markets. While expense growth in secondary markets has exceeded that in gateway markets since 2020, recent rates of expense growth have shifted with growth in gateway markets exceeding that in secondary markets.
The report also notes that expense growth is a bigger issue for affordable properties than for market rate properties. Expenses at affordable properties consume a larger share of income, on average. Also, affordable properties may have a harder time raising rents to cover rising expenses.
Tabulating the data
Yardi Matrix reports on other key rental market metrics in addition to rent growth. These include the year-over-year job growth rate based on the 6-month moving average and the completions over the prior 12 months as a percentage of existing stock. The 10 metros with the largest annual apartment rent increases are listed in the table below, along with the other data.
| City | YoY rent | YoY rent last month |
YoY jobs (6 mo moving avg) |
Completions as % of stock |
| Chicago | 4.1 | 3.6 | 0.4 | 1.6 |
| Columbus | 3.9 | 3.3 | 1.0 | 2.4 |
| Detroit | 3.5 | 2.9 | 0.5 | 0.8 |
| New Jersey | 2.7 | 2.3 | 1.2 | 3.4 |
| San Francisco | 2.6 | 2.2 | (0.5) | 2.2 |
| New York | 2.5 | 3.1 | 1.5 | 2.4 |
| Twin Cities | 2.4 | 2.4 | 0.7 | 3.6 |
| Kansas City | 2.3 | 3.2 | 0.2 | 2.2 |
| Baltimore | 2.1 | 1.6 | 0.6 | 1.5 |
| Indianapolis | 1.9 | 2.4 | 0.5 | 3.3 |
The major metros with the smallest year-over-year apartment rent growth as determined by Yardi Matrix are listed in the next table, below, along with the other data as in the table above.
| City | YoY rent | YoY rent last month |
YoY jobs (6 mo moving avg) |
Completions as % of stock |
| Austin | (4.6) | (4.7) | 1.5 | 9.5 |
| Denver | (3.9) | (3.9) | 0.1 | 6.4 |
| Phoenix | (2.8) | (2.6) | 0.2 | 5.1 |
| Las Vegas | (1.7) | (1.1) | 0.3 | 3.3 |
| Dallas | (1.5) | (1.2) | 1.2 | 3.9 |
| San Diego | (1.3) | (0.9) | 0.6 | 2.3 |
| Charlotte | (1.0) | (0.6) | 1.7 | 6.6 |
| Orlando | (1.0) | (1.2) | 2.1 | 5.5 |
| Nashville | (0.6) | (1.0) | 0.8 | 6.6 |
| Raleigh | (0.6) | (0.5) | 1.7 | 6.1 |
The top metros for month-over month rent growth in July were Detroit, New York, Columbus and Baltimore. Only Columbus was in the top 4 in last month’s report. The trailing metros this month were Kansas City, San Diego, Tampa and Las Vegas. None of these was in the bottom 4 in last month’s report.
Single-family rentals rents rise, but slowly
Yardi Matrix also reported that single-family rental build-to-rent (SFR) rents rose $3 in July from the revised level of the month before to $2,205 per month. SFR rents were up 0.4 percent year-over-year.
Yardi Matrix reported on the top 30 markets for built-to-rent single-family rentals, 17 of which saw rents grow year-over-year in July. The leading markets for year-over-year rent growth were Chicago, Kansas City, Inland Empire and Harrisburg, the same as in last month’s report.
The markets with the lowest year-over-year rent growth were Raleigh, Austin, Tampa and Cleveland, also the same as in last month’s report.
The national occupancy rate for single-family rentals was unchanged from the revised level of the month before at 95.0 percent. This is up 0.1 percentage points from the level reported last month. The national occupancy rate was down 0.3 percent year-over-year.
This month, 15 of the metros saw year-over-year occupancy increases. The metros with the largest year-over-year occupancy increases were Jacksonville, Atlanta, Indianapolis and Inland Empire. The metros with the greatest occupancy declines were Pensacola, Las Vegas, Harrisburg and Denver.
The complete Yardi Matrix report provides information on some of the smaller multifamily housing markets and more information on the differences in results between lifestyle and RBN properties. It can be found here.


