

CoStar reported that its value-weighted index of multifamily property prices fell month-over-month in August, dropping 1.31 percent, its sixth consecutive monthly decline. However, CoStar reported that this index was still up 1.84 percent year-over-year.
By contrast, MSCI Real Capital Analytics reported that multifamily property prices were effectively unchanged for the month and up 0.2 percent year-over-year in August.
The value-weighted index of non-multifamily commercial property rose 1.38 percent month-over-month in August. However, this index is down 1.00 percent year-over-year. The other commercial property types tracked by CoStar are office, retail, industrial and hospitality.
For more information on the CoStar Commercial Repeat Sales Indexes (CCRSI’s), please see the description at the bottom of this report.
Multifamily property prices dropping
The first chart, below, shows the history of the value-weighted CCRSI’s since January 2016 for multifamily property and for all other commercial property considered as a single asset class. It also shows trend lines for the growth in the two CCRSI’s based on their growth in the period from January 2012 to January 2020. The indexes are normalized so that their values in December 2000 are set to 100.
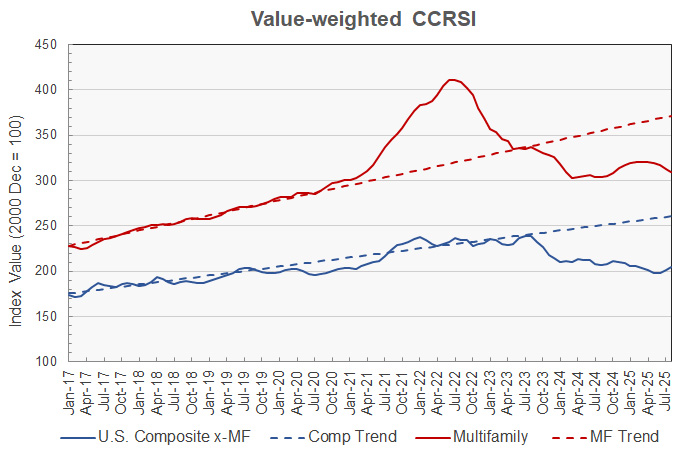
The chart shows that multifamily property prices seemed to have started an upward trend last year. However, after rising for six consecutive months, they turned lower again. While this month’s decline is slightly less than that reported for last month, the improvement is minimal, indicating continuing downward momentum.
Multifamily property prices are down 24.9 percent from their all-time high. They are 16.7 percent below their pre-pandemic trend.
Prices for other commercial property types rose for the third consecutive month in August after declining for the 16 of the 24 prior months. These prices are now 14.4 percent below their high point and 21.6 percent below their pre-pandemic trend.
The second chart shows the recent history of multifamily property prices and other commercial property prices based on this month’s data along with the estimates from last two month’s reports. For purposes of this chart, the price indexes for both property groupings were each set to a value of 100 in March 2024 relative to the price indexes for that date in the current report. This allows the indexes to be plotted together at a scale that shows the detailed price movements.
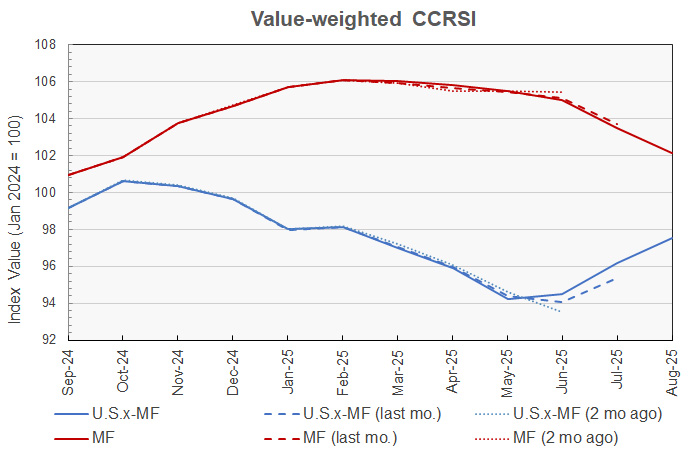
The chart shows that new transactions added to the multifamily data set did not make a significant difference in the reported price levels. However, the more recent data did slightly reduce the price index originally reported for June. The current index reported for June is 0.4 percent lower than that originally reported for that month.
This month’s revisions to the non-multifamily property price data show a more positive recent pricing trend than that originally reported. The month-over-month price change for June was originally reported to be a 1.2 percent drop. However, June’s initially reported decline is now seen as a price rise. The price indexes for July and August are also seen as rising in the latest report.
Transaction volumes trending lower
An issue with monthly transaction volume reporting is that CoStar usually identifies additional transactions to tabulate over the next few months after the initial report for a given month. These extra transactions tend to make initial reports of falling transaction volumes appear more negative than they will subsequently appear. For example, CoStar reported that the transaction volume in August for all property types was down 114 transactions from the revised level of the month before, but it was down only 3 transactions from the preliminary level for July reported last month.
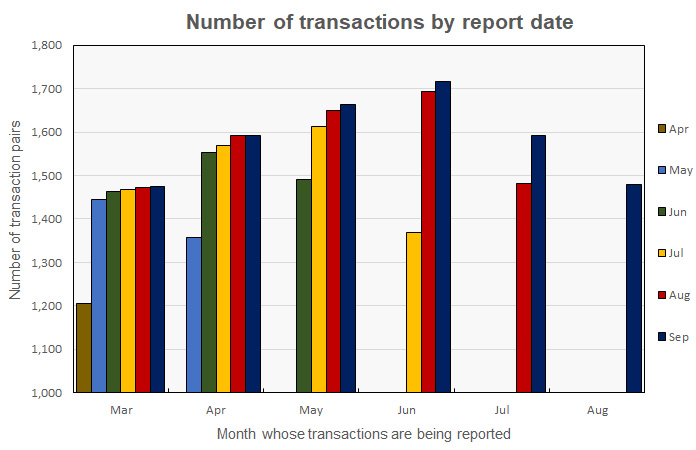
CoStar reported that their initial transaction count for August was 1,479 repeat sales pairs. This is down 0.2 percent from the 1,482 transaction pairs identified for July in last month’s report but down 7.2 percent from the 1,593 transaction pairs identified for July in this month’s report.
The history of the revisions to the transaction counts for recent months is illustrated in the next chart. It shows that the number of transactions for March was initially given as 1,205 in the April report and the count has been raised in every subsequent report. While the size of the transaction count revision was largest in the next month’s report, additional transaction pairs for March continued to be identified in every subsequent report. The current report identifies 1,475 transactions for March. By contrast, transaction data for August only appears in the current (September) report. We can expect it to be revised next month.
The preliminary dollar volume of transactions in August was reported to fall 6.0 percent from the revised level of the month before to $10.66 billion. However, the dollar volume of transactions was down only 0.4 percent from the preliminary level for July reported last month.
Distress levels rising slowly
CoStar also reported on the portion of sales that would be considered “distressed”. The next chart shows the distressed sales trends for combined investment grade and commercial grade property sales. Multifamily distressed sales are not separated out from those of other property types in this data. Because of volatility in the data, the chart presents the 3-month weighted moving average of CoStar’s distressed sales data.
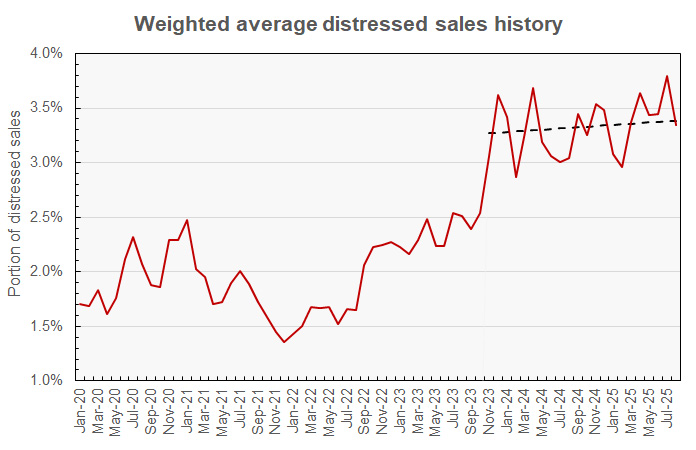
The chart also shows a straight-line fit to the unaveraged distress rates reported since November 2023. The fit implies a slight rising trend in the distress rate since then. The “fit” distress rate has increased by 0.12 percentage points since November 2023.
The full report discusses all commercial property types. While the CoStar report provides information on transaction volumes, it does not break out multifamily transactions. The latest CoStar report can be found here.
CCRSI defined
The CoStar report focuses on a relative measure of property prices called the CoStar Commercial Repeat Sales Index (CCRSI). The index is computed based on the resale of properties whose earlier sales prices and sales dates are known. The index represents the relative change in the price of property over time rather than its absolute price. CoStar identified 1,479 repeat sale pairs in August for all property types. These sales pairs were used to calculate the results quoted here.
CoStar computes CCRSI’s for a variety of property groupings, combining them by cost, region, property type or other factors. The value-weighted index is more heavily influenced by transactions of expensive properties than is CoStar’s equal-weighted index. The value-weighted index is the focus of this report because it is an index whose value is reported monthly and for which CoStar breaks out multifamily property as a separate category.


