

The latest rent report from Apartment List shows that national median rent fell in September with month-over-month rent growth of -0.42 percent. As it has been for the last two years, year-over-year rent growth was negative at -0.79 percent. Apartment List reported the national median apartment rent to be $1,394, down $6 from last month’s figure.
Charting the data
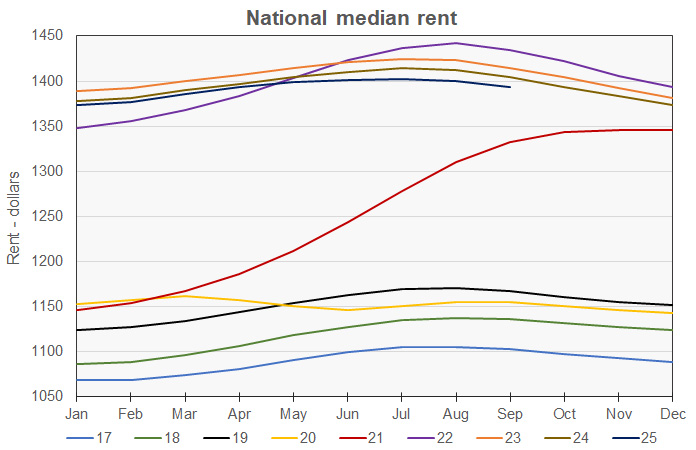
The first chart shows the history of the national median rent level since 2017. It is plotted year-by-year so that the annual change pattern is visible. The chart shows that rents are trailing those of the prior year for the third year in a row. The gap between current and prior year rents contracted slightly this month after 5 months of expansion.
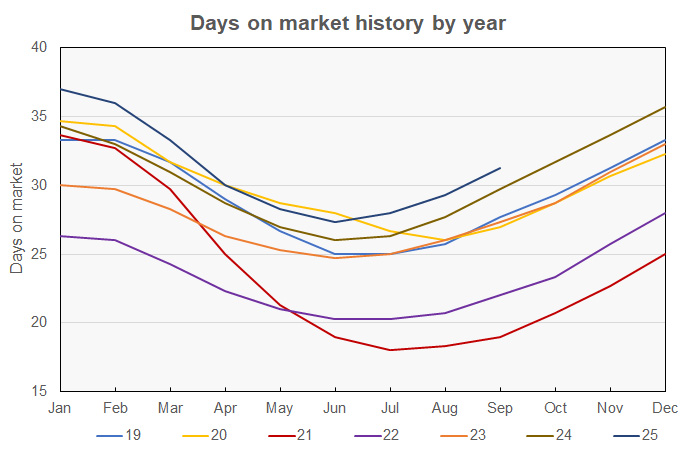
The next chart shows the national average number of days a unit listed on Apartment List stayed on the market until it was leased. The chart shows that days-on-market (DOM) grew again in September, in line with seasonal patterns. The DOM monthly readings for 2025 continue to be the highest for any year in the Apartment List dataset with the exception of the pandemic-shutdown year of 2020.
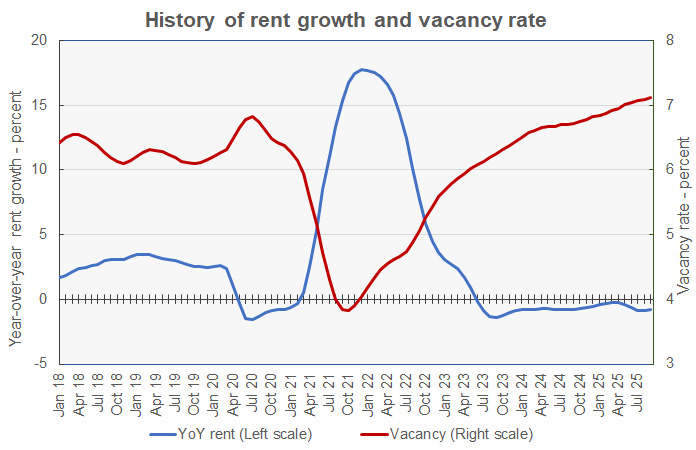
The next chart shows the year-over-year rate of rent growth since January 2018 plotted along with the national median apartment vacancy rate. The chart shows that the national average vacancy rate continues to creep higher, reaching another new high for the Apartment List dataset. Its reading of 7.11 percent was up from 7.09 percent last month. However, the monthly increase in the vacancy rate was the lowest since January. The chart also shows year-over-year rent growth, which has been negative since May 2023.
The final chart shows the change in the national median apartment rent since January 2017 in nominal dollar terms along with two other measures of rent accounting for changes in income and price levels. The Income adjusted curve adjusts the rent by the change in average hourly earnings of all employees as reported by the Bureau of Labor Statistics. The Inflation adjusted curve adjusts the rent by the general change in price level as measured by the not-seasonally-adjusted Consumer Price Index for all urban consumers (CPI-U).
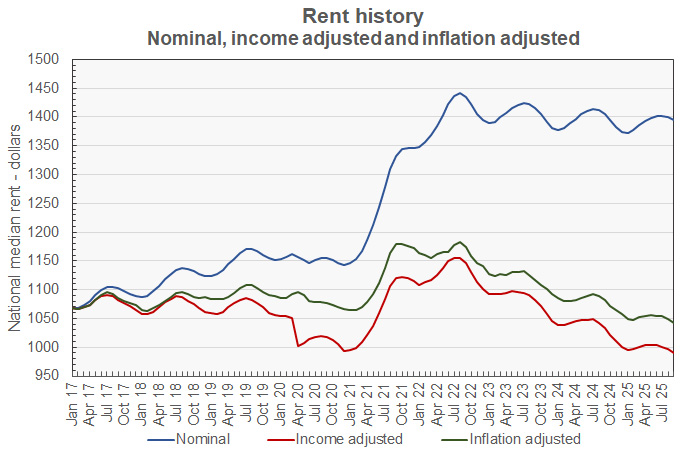
The curves show that, while rents surged in the wake of the pandemic, government data indicates that wages also rose rapidly. As a result. when adjusted for wage growth or for the general increases in prices, rents are below their pre-pandemic levels. Since January 2017, average rents are up 31.0 percent while average hourly earnings are up 40.7 percent and inflation as measured by the CPI-U is up 33.2 percent.
Ranking the metros
Apartment List provides the underlying data they collected in compiling their report and that data was used to create the tables, below. The tables look at the 54 metropolitan statistical areas defined by the US Census Bureau whose populations exceed one million people and identify the top and bottom 10 metros for year-over-year rent growth. The tables provide the median monthly rent in the metro, the percentage change from the prior month’s rent level (MoM Metro), the annual percentage change in rent (YoY Metro) and the metro’s vacancy rate. They also list the days on market (DOM) metric, although this data is not available for all metro areas.
The first table shows the 10 metros with the largest annual rent percentage increases.
| Metro | Metro Rent | MoM Metro | YoY Metro | Vacancy rate | DOM |
| San Francisco | $2,687 | 0.04 | 4.9 | 4.8 | 28.3 |
| Chicago | $1,690 | (0.34) | 4.1 | 5.4 | 31.3 |
| Fresno | $1,401 | 0.87 | 4.1 | 0.0 | |
| San Jose | $3,088 | (0.31) | 3.8 | 5.3 | 29.0 |
| Providence | $1,504 | 0.26 | 3.6 | 4.6 | |
| Minneapolis | $1,508 | (0.16) | 3.3 | 7.0 | 36.7 |
| Virginia Beach | $1,622 | (0.06) | 2.9 | 5.1 | 19.7 |
| Pittsburgh | $1,236 | (0.34) | 2.9 | 6.4 | 35.3 |
| New York | $2,301 | (0.25) | 2.7 | 4.7 | 32.5 |
| Richmond | $1,476 | (0.39) | 2.5 | 6.6 |
The next table shows the 10 metros with the smallest annual rent increases.
| Metro | Metro Rent | MoM Metro | YoY Metro | Vacancy rate | DOM |
| Austin | $1,326 | (0.85) | (6.5) | 9.8 | 39.0 |
| Denver | $1,693 | (0.83) | (5.1) | 8.6 | 33.0 |
| Phoenix | $1,376 | (0.62) | (4.4) | 8.4 | 35.7 |
| Tucson | $1,145 | (0.92) | (4.2) | 8.4 | 44.8 |
| New Orleans | $1,174 | (1.52) | (3.7) | 5.6 | |
| San Antonio | $1,203 | (0.68) | (3.6) | 9.2 | 38.3 |
| Las Vegas | $1,454 | (0.96) | (2.3) | 6.9 | 32.0 |
| Memphis | $1,113 | (0.25) | (1.9) | 8.9 | |
| Orlando | $1,541 | (0.44) | (1.9) | 7.4 | 29.3 |
| Dallas | $1,443 | (0.30) | (1.7) | 8.7 | 36.0 |
In September, 29 of the 54 most populous metros saw their rents rise on a year-over-year basis. However, only 10 of them saw rents rise on a month-over-month basis.
The complete Apartment List report covers many more metros and also provides city, county and state data. It gives readers with the opportunity to download their data sets. The latest report can be found here.


