

The National Association of Home Builders (NAHB) recently released its Home Builders Geography Index (HBGI) report for Q2 2025. It does not look at absolute numbers of permits issued but rather looks at what type of community is attracting the greatest share of permits that are issued. This quarter, the two geographic categories that had been leading in year-over-year multifamily permit growth rates took a step back.
Defining the regions
The NAHB report looks at building permit data by county. It categorizes the counties by population density and location and sorts each county into one of 7 categories. Those categories are: Large Metro – Core County, Large Metro- Suburban County, Large Metro – Outlying Areas, Small Metro – Core County, Small Metro – Outlying County, Micro County, Non Metro/Micro County.
The HBGI tracks permit data based on 4-quarter moving averages without seasonal adjustment and looks at the share of total permits in each geographic category as well as the growth rate in the number of permits.
Shifting market share
The first chart shows how the market share of multifamily permit issuance in each of the geographic categories has shifted over time.
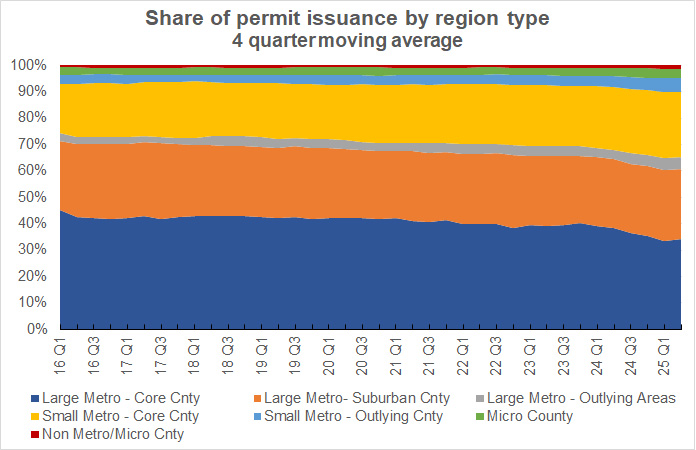
The chart shows that, while the large metro share of multifamily permits had been decreasing, especially since 2020, it rose in the latest report. The gain came from an increase in the share of permits for the core cities of the large metros, which rose from 33.4 percent to 34.0 percent. Despite the share of permits in suburban counties of large metros remaining flat and the share in outlying areas decreasing, this was enough to raise the overall large metro share from 64.9 percent to 65.1 percent of multifamily permits.
The combined share of multifamily permits in small metros edged higher in the latest report, continuing a trend that has been underway since 2016. While the share of permits in the core cities of the small metros declined by 0.1 percentage point, that in the outlying counties rose by 0.2 percentage points to bring the overall small metro share to 30.2 percent.
Micro counties were the losing region. Its share of multifamily permits fell from 3.8 percent to 3.5 percent.
The next chart shows the change in multifamily permit market share for each of the geographic categories compared to its average level in the 2016 to 2018 period.
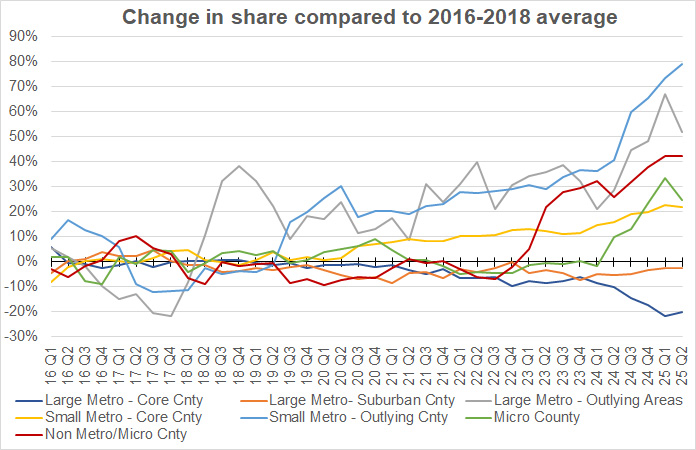
The chart shows that the two regions with the largest share of multifamily permits, core counties and suburban cities of large metro areas, both have been losing share relative to their shares in the earlier period. The regions with the greatest increase in share of permits are those with small shares. The biggest gainer was the outlying counties of small metro areas, whose share increased by 79 percent compared to its level in the 2016 to 2018 period. Still, that left its share of multifamily permits at only 5.3 percent.
Absolute growth
The last chart shows the 4-quarter not-seasonally-adjusted year-over-year rate of growth in multifamily permits since 2016.
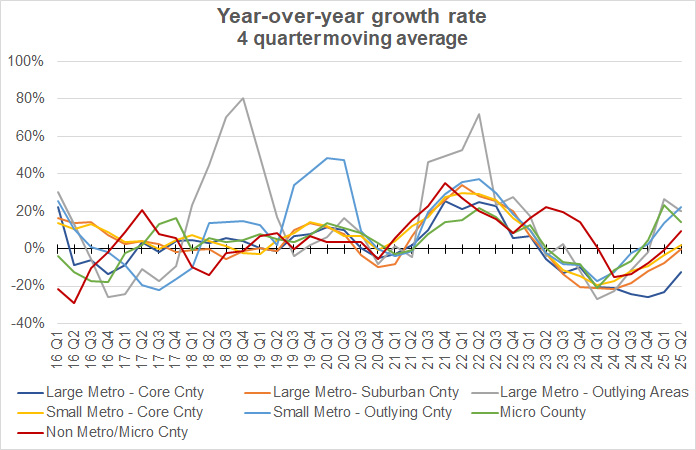
While outlying areas in large metros and micro counties had seen the highest growth rates in permits issued last quarter, they both dropped back this quarter. Outlying counties in small metro areas achieved the highest year-over-year growth rate in multifamily permits with a gain of 22.1 percent.
The full HBGI report also covers shifts in single-family housing permits. It can be found here.


