

The Employment Situation Report from the Bureau of Labor Statistics (BLS) stated overall employment growth slowed in August. The employment levels for the 4 multifamily-related jobs categories that we track were all lower than the preliminary levels reported last month.
Employment reports continue to weaken
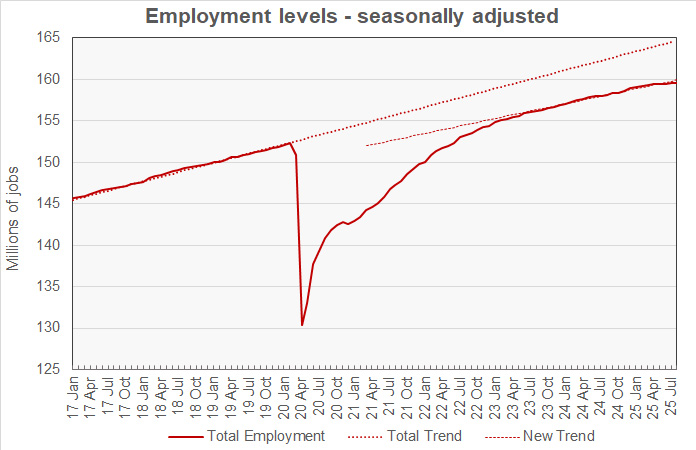
The BLS reported that total seasonally adjusted non-farm employment increased by 22,000 jobs (+0.01 percent) to 159,540,000 jobs in August, based on their survey of business establishments. However, the employment level initially reported for July was revised lower by 21,000 jobs so the employment in this month’s report is only 1,000 jobs higher than that in last month’s report.
Revisions to the employment levels in earlier months caused the employment gain of 73,000 jobs reported last month for July to be revised higher to 79,000 jobs, but they caused the gain of 14,000 jobs reported for June to be revised to a loss of 13,000 jobs. This is the first decline indicted by the business survey since the COVID shutdowns.
With the downward revisions to the employment growth figures for June and July, the trailing 6-month average employment gain dropped to 64,000 jobs from 81,000 jobs last month. Since April, the economy has averaged a gain of only 27,000 jobs per month.
The history of the overall U.S. employment level is shown in the first chart, below. It also shows trend lines for both the pre-pandemic and post-pandemic periods, the latter since May 2023.
The BLS household survey reported that the US unemployment rate rose to 4.3 percent. When computed to 2 decimal places, the unemployment rate rose from 4.25 percent to 4.32 percent. The household survey found that the number of employed people was 163,394,000. This is 288,000 more people than the figure reported last month. The number of unemployed people was 7,384,000, up 148,000 from last month’s reported figure.
The household survey also found that the number of people in the civilian labor force was 170,778,000. This is up by 436,000 people compared to last month’s survey but down 357,000 people from April’s survey. The labor force participation rate rose by 0.11 percentage points to 62.33 percent. It had been at 63.33 percent before the pandemic. Recovering that 1.0 percent decline in the labor force participation rate would bring 2.75 million more people into the workforce.
The next chart shows the recent reports on total employment based on the survey of business establishments. It shows that the revisions to the overall employment level in the August report were smaller than those made in the July report. However, in both reports, all revisions lowered the reported employment levels.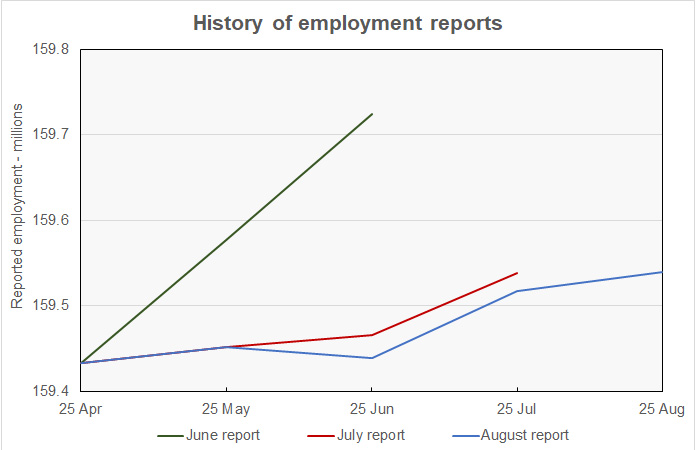
Tracking multifamily employment
The BLS reported more detailed employment information on four job categories of interest to the multifamily industry. These are employment as residential construction workers, as specialty trades within residential construction, as residential property managers and as lessors of residential buildings. As usual, some of the data was reported with a one month delay, so the latest figures for the latter two categories are for the month of July.
Residential construction employment falls
The next chart shows the history of the levels of employment since 2017 in the two construction jobs categories we track, both of which turned in weak performances in August.
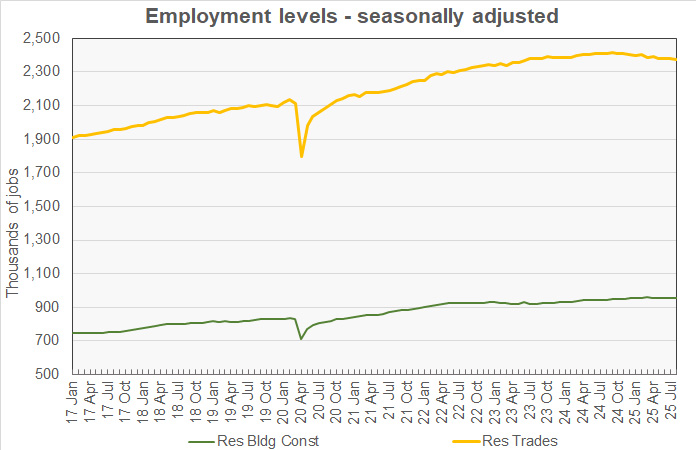
Employment in residential building construction in August, usually with general contractors, was reported to be down by 900 jobs. However, the prior month’s employment level was revised higher by 300 jobs so reported employment in this category is 600 jobs lower than the preliminary value reported last month. Employment in this category is now 954,100 jobs, up 1.0 percent year-over-year.
Employment in residential building trades, i.e. plumbers, electricians, etc., in August was reported to be down by 5,200 jobs from last month’s level. However, the July jobs figure was revised higher by 800 jobs so employment in this category is 4,400 jobs lower than the level reported last month. Employment in residential building trades is now 2,373,600 jobs, down 1.5 percent year-over-year.
Total August employment in these two categories of residential construction jobs combined is down 0.2 percent from the revised level of the month before. It is down 0.8 percent year-over-year.
Property management jobs also decline
The next chart shows the history of the levels of employment since 2017 in the two property management jobs categories we track.
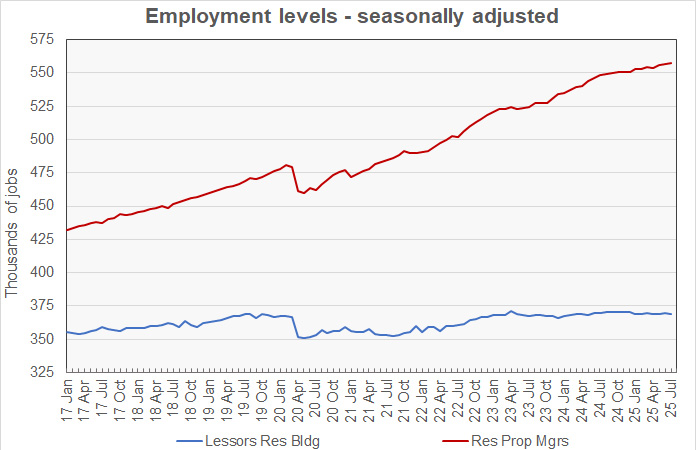
Employment for residential property managers in July was reported to be up by 900 jobs from its revised (-1,300 jobs) level for June to 557,700 jobs. Employment in this category is up 1.6 percent year-over-year.
Employment for lessors of residential buildings in July was reported to be down 400 jobs from its revised (+100 jobs) level for June at 369,300 jobs. Employment in this category is down 0.1 percent year-over-year.
Total employment in these two categories of apartment operations jobs combined was reported to be up 0.05 percent from the revised level for last month and up 0.96 percent year-over-year.
Multifamily employment runs below trend
The final chart, below, presents the employment data in a different format. It normalizes the employment levels in each of the four jobs categories to a reading of 100 for January 2015. It also provides trend lines for the growth in each of the categories of employment based on the period from January 2015 through February 2020.
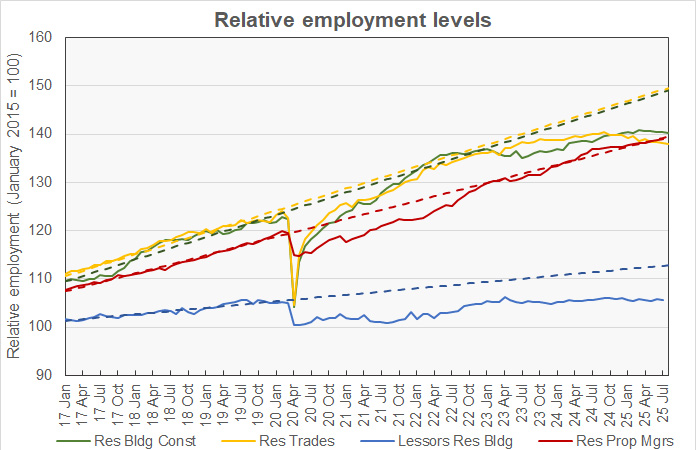
Residential building construction employment is now 5.9 percent below trend. Residential trades employment is now 7.8 percent below trend. Residential property managers employment is 0.1 percent below trend and lessors of residential buildings employment is now 6.3 percent below trend.
The numbers given in the Employment Situation report are seasonally adjusted and are subject to revision. It is common for small adjustments to be made in subsequent reports, particularly to the data for the most recent month. The current Employment Situation report can be found here.


