

Yardi Matrix reported that the national average asking apartment rent fell $1 in August compared to the revised level of the month before to $1,755 per month. The national average year-over-year asking apartment rent growth was +0.7 percent, the same growth as reported last month. The month-over-month rent growth rate was -0.1 percent.
Rents in the “lifestyle” asset class, usually Class A properties, were up 0.3 percent year-over-year. Rents in “renter by necessity” (RBN) properties increased by 1.2 percent year-over-year. The lifestyle rent growth is unchanged from last month’s reported rate while the RBN rent growth is down 0.3 percentage points. The following chart shows the history of the year-over-year rent growth rates for these two asset classes along with the difference between these rates.
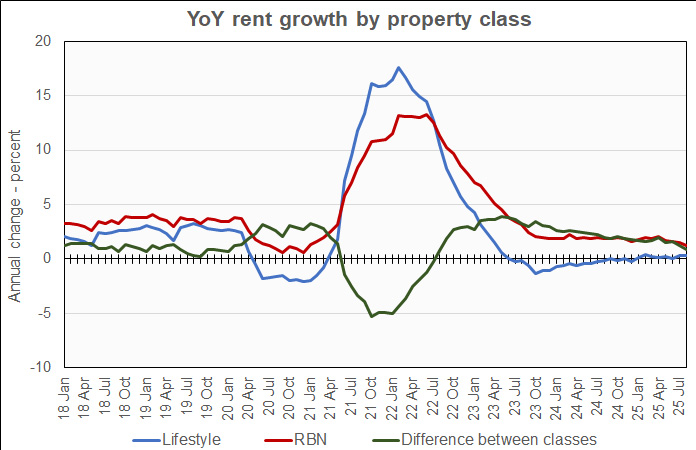
The chart shows that the year-over-year rent growth rate in the RBN class had been hovering around 2 percent for over a year, but it has been trending lower over the last 4 months. Lifestyle rent growth had been negative for over a year from mid-2023 to mid-2024. However, it has now racked up 8 consecutive months of non-negative rent growth.
Yardi Matrix reported that the U.S. average occupancy rate in July was unchanged from the level of the month before at 94.7 percent. The occupancy rate is also unchanged year-over-year.
Governments respond to the problem
The discussion section of this month’s report focused on the steps being taken at various levels of government to address the present high cost of housing. Over 400 pieces of legislation supportive of housing development have been introduced, 100 have been passed by legislatures and 70 have been signed into law. States as diverse as California and Texas have advanced housing-supportive legislation.
At the Federal level, legislation was passed to expand the Low-Income Housing Tax Credit (LIHTC) program. The Opportunity Zone program, which was on the verge of sun-setting, has also been given new life by the One Big Beautiful Bill Act.
While these efforts are welcome, they are being launched in an environment of falling construction starts, which may mute their impact.
Tabulating the data
Yardi Matrix reports on other key rental market metrics in addition to rent growth. These include the year-over-year job growth rate based on the 6-month moving average and the completions over the prior 12 months as a percentage of existing stock. The 10 metros with the largest annual apartment rent increases are listed in the table below, along with the other data.
| City | YoY rent | YoY rent last month |
YoY jobs (6 mo moving avg) |
Completions as % of stock |
| Chicago | 4.0 | 4.1 | 0.5 | 1.6 |
| Columbus | 3.3 | 3.9 | 1.1 | 2.4 |
| Twin Cities | 3.2 | 2.4 | 0.8 | 3.0 |
| New York | 3.0 | 2.5 | 1.4 | 2.6 |
| Detroit | 2.7 | 3.5 | 0.5 | 0.9 |
| Philadelphia | 2.6 | 1.8 | 1.2 | 1.5 |
| Kansas City | 2.5 | 2.3 | 0.1 | 1.9 |
| San Francisco | 2.5 | 2.6 | (0.5) | 2.1 |
| New Jersey | 2.3 | 2.7 | 1.1 | 3.0 |
| Boston | 2.1 | 1.4 | (0.1) | 2.8 |
The major metros with the smallest year-over-year apartment rent growth as determined by Yardi Matrix are listed in the next table, below, along with the other data as in the table above.
| City | YoY rent | YoY rent last month |
YoY jobs (6 mo moving avg) |
Completions as % of stock |
| Austin | (4.5) | (4.6) | 1.3 | 8.9 |
| Denver | (3.8) | (3.9) | 0.0 | 5.8 |
| Phoenix | (2.8) | (2.8) | 0.1 | 5.1 |
| Dallas | (1.8) | (1.5) | 1.2 | 3.8 |
| Las Vegas | (1.4) | (1.7) | 0.2 | 2.8 |
| San Diego | (1.3) | (1.3) | 0.7 | 2.2 |
| Orlando | (1.2) | (1.0) | 2.0 | 5.8 |
| Portland | (0.7) | (0.2) | 0.0 | 2.9 |
| Charlotte | (0.6) | (1.0) | 2.0 | 6.6 |
| Miami Metro | (0.4) | (0.4) | 1.2 | 4.3 |
The top metros for month-over month rent growth in August were Philadelphia, Kansas City, Twin Cities and Atlanta. None of these was in the top 4 in last month’s report. Even more surprising, Kansas City was in the bottom 4 last month. The trailing metros this month were Baltimore, Orlando, Detroit and Seattle. None of these was in the bottom 4 in last month’s report.
Single-family rentals rents unchanged
Yardi Matrix also reported that single-family rental build-to-rent (SFR) rents were unchanged in August from the revised (+$3) level of the month before at $2,208 per month. SFR rents were up 0.6 percent year-over-year.
Yardi Matrix reported on the top 30 markets for built-to-rent single-family rentals, 18 of which saw rents grow year-over-year in August. The leading markets for year-over-year rent growth were Chicago, Kansas City, Twin Cities and Columbus.
The markets with the lowest year-over-year rent growth were Austin, South Dakota, Tampa and Raliegh.
The national occupancy rate for single-family rentals remained at 95.0 percent in July, the same rate as was reported last month. The national occupancy rate was down 0.2 percent year-over-year.
This month, 17 of the metros saw year-over-year occupancy increases. The metros with the largest year-over-year occupancy increases were Miami, Jacksonville, San Antonio and Dallas. The metros with the greatest occupancy declines were Columbus, Central Valley, Harrisburg and Pensacola.
The complete Yardi Matrix report provides information on some of the smaller multifamily housing markets and more information on the differences in results between lifestyle and RBN properties. It can be found here.


