

The latest commercial property price report from MSCI Real Capital Analytics said that multifamily property prices were down 0.3 percent in September compared to the revised level of the month before. Multifamily property prices were down 0.8 percent year-over-year.
Defining CPPI
MSCI tracks an index called the Commercial Property Price Index (CPPI). The index is computed based on the resale prices of properties whose earlier sales prices and sales dates are known. The index represents the relative change in the price of property over time rather than its absolute price. Note that, as new property transactions are added to the MSCI dataset each month, they recalculate the CPPI for the months in which the transactions occurred, potentially all the way back to the beginning of the data series.
Multifamily property prices in decline
The first chart, below, shows how the CPPI’s for all commercial property as a single asset class and for apartments have changed since January 2016. Both CPPI’s have been normalized to values of 100 in January 2012. The chart also contains trend lines showing the straight-line average rates of price appreciation for the two asset classes based on their performances from January 2012 to December 2019, a period in which property price appreciation was remarkably steady.
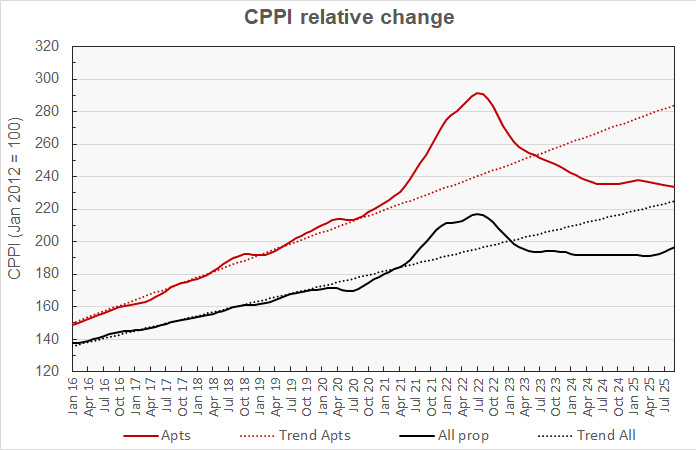
The chart shows that multifamily property prices were on an upward trend in the latter part of last year. However, after reaching a local high in February, they have been declining. Current multifamily property prices are 1.8 percent below their February level. The chart also shows that, after seeing little change since January 2024, overall commercial property prices have been moving higher for the last 3 months. They are up 2.8 percent since their recent low in April.
Multifamily property prices are now down 19.9 percent from their peak but are 11.2 percent above their level in January 2020. They are 17.9 percent below their pre-pandemic trend line.
Prices for all commercial property as a single asset class were up 0.7 percent month-over-month in September and were up 2.6 percent year-over-year. They are now 9.5 percent below their peak but are 15.0 percent above their level in January 2020. They are 12.6 percent below their pre-pandemic trend.
The next chart plots the month-over-month changes in the values of the CPPIs over the last 13 months for all commercial property as a single asset class and for apartments. It also includes the same metrics based on the data included in last month’s report and the report from the month before that. For purposes of this chart, the price indexes are normalized to their values in September 2024 in the current report.
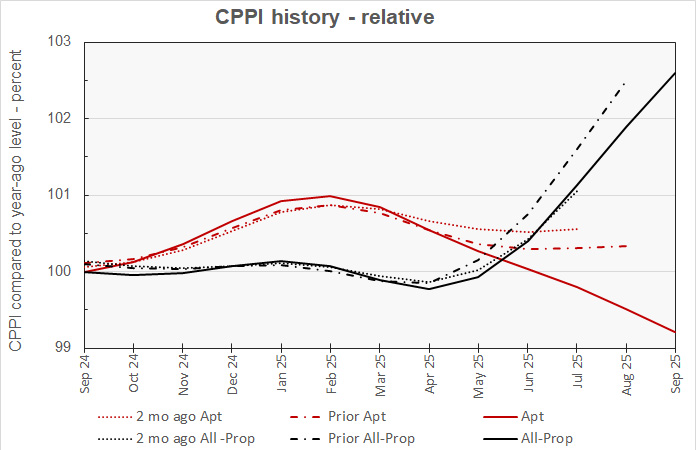
The chart shows that the prior 2 reports had indicated that multifamily property prices had stabilized. However, transactions added to the dataset this month paint a gloomier picture with prices reported as declining over the last 4 months. The current price index for July is 0.75 percent below the level initially reported while that for August is 0.81 percent below the level in last month’s report.
The new pricing data added for the all-property index indicate that prices are lower than reported last month but are largely in line with those reported 2 months ago.
Other property prices move higher
In September, MSCI found that prices rose for all the main property types they track other than for multifamily. The CPPI for suburban offices rose 1.4 percent for the month while the CPPI for offices in central business districts (CBDs) rose 1.1 percent. Industrial property prices rose by 0.4 percent while prices for retail property also rose 0.4 percent.
On a year-over-year basis, retail property prices saw a 5.5 percent increase. Industrial property prices were up 4.0 percent while prices for suburban offices rose 4.5 percent and prices for offices in CBDs rose 5.1 percent.
Major metro commercial property prices climb
The MSCI report provides data comparing the price changes of commercial property in 6 major metro* areas against those in the rest of the country, although it does not separate apartments from other commercial property types in this comparison. The next chart, below, plots the history of the relative price indexes since January 2016 for both market segments, along with trend lines based on straight-line fits to the changes in these indexes between January 2012 and December 2019. For purposes of this chart, both price indexes were set to values of 100 for January 2012.
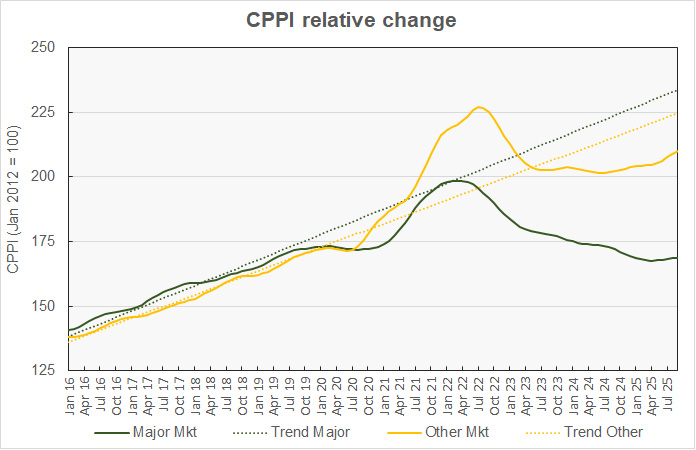
The chart shows that the CPPI for major metro commercial property has been increasing recently. In the latest report, the major metro property price index is up 0.2 percent month-over-month. However, this price index is still down 1.8 percent year-over-year. The index is down 15.0 percent from its peak and is now 2.4 percent below its level in January 2020. It is 27.8 percent below its long-term trend.
The latest data shows that the CPPI for non-major markets has been moving higher since July 2024. Year-over-year changes in this index have been positive since December 2024. The non-major metro CPPI is up 0.6 percent month-over-month and up 4.0 percent year-over-year. It is down 7.4 percent from its peak but is 22.1 percent above its level in January 2020. The non-major metro CPPI is 6.5 percent below its pre-pandemic trend.
The final chart plots the history of the month-over-month changes in the price indexes for the two property market segments over the last 13 months along with the monthly price change data from the last two reports.
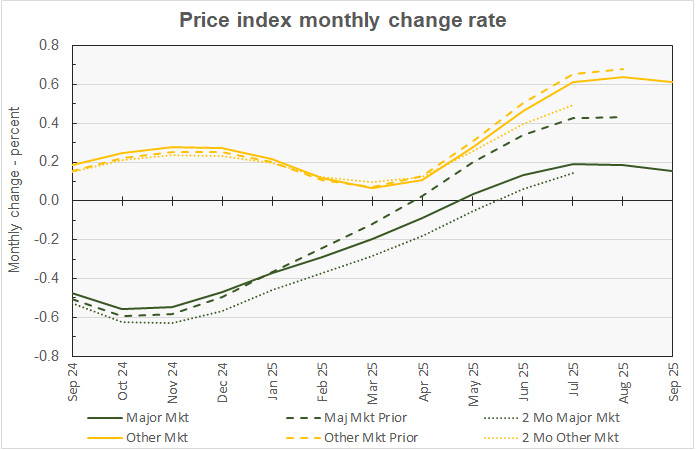
The chart shows that the latest data indicates that the monthly rate of price gain is only slightly lower than that reported last month for non-major metros, but it is significantly lower than that reported last month for major metros.
The major metro month-over-month price gain for July was initially reported to be 0.14 percent. It was revised to a price increase of 0.43 percent last month and to a rise of only 0.19 percent this month. The non-major metro month-over-month price rise for July was initially reported to be 0.50 percent, but it was revised to a gain of 0.66 percent last month and to a gain of 0.61 percent this month.
The full report provides more detail on other commercial property types. Access to the MSCI Real Capital Analytics report can be obtained here.
*The major metros are Boston, Chicago, Los Angeles, New York, San Francisco and Washington DC.


