

Yardi Matrix reported that the national average asking apartment rent fell $6 in September compared to the revised level of the month before to $1,750 per month. The national average year-over-year asking apartment rent growth was +0.6 percent, down 0.1 percentage points from the rate reported last month. The month-over-month rent growth rate was -0.3 percent.
Rents in the “lifestyle” asset class, usually Class A properties, were unchanged year-over-year. Rents in “renter by necessity” (RBN) properties increased by 1.2 percent year-over-year. The lifestyle rent growth is down 0.3 percentage points from last month’s reported rate while the RBN rent growth is unchanged. The following chart shows the history of the year-over-year rent growth rates for these two asset classes along with the difference between these rates.
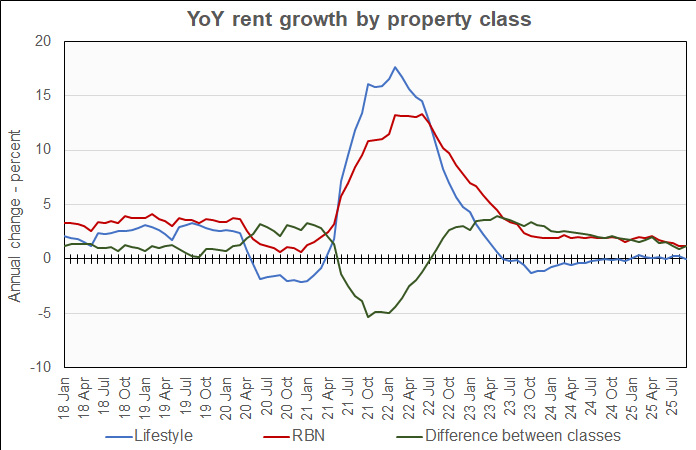
The chart shows that the difference between the lifestyle and RBN year-over-year rent growth rates is now nearly the same as it was in the 2 years before the pandemic. However, the actual rent growth rates for the two classes of property are each nearly 2 ½ percentage points below where they were pre-pandemic.
Yardi Matrix reported that the U.S. average occupancy rate in August was unchanged from the level reported for the month before at 94.7 percent. As was the case last month, the occupancy rate is unchanged year-over-year.
Slower household formation coming
The discussion section of this month’s report focused on two key drivers of apartment demand, job growth and household formation.
The bad news is that job growth has significantly slowed in recent months, with the latest employment situation report indicating growth of only 22,000 jobs in August. The good news is that the Fed recently cut interest rates, an action that may lead to higher job growth ahead.
The discussion around household formation largely centered on a report from Harvard’s Joint Center for Housing Studies (JCHS), which indicated that household formation may slow from the average pace of the last 25 years. However, while overall household formation is projected to slow, the relative unaffordability of homeownership is supporting the formation of renter households. JCHS projects that 1.2 million renter households will be added in 2025, behind only 2015 for growth over the past 25 years.
Tabulating the data
Yardi Matrix reports on other key rental market metrics in addition to rent growth. These include the year-over-year job growth rate based on the 6-month moving average and the completions over the prior 12 months as a percentage of existing stock. The 10 metros with the largest annual apartment rent increase rates are listed in the table below, along with the other data.
| City | YoY rent | YoY rent last month |
YoY jobs (6 mo moving avg) |
Completions as % of stock |
| New York | 4.8 | 3.0 | 1.4 | 3.0 |
| Chicago | 3.9 | 4.0 | 0.5 | 1.6 |
| Twin Cities | 3.4 | 3.2 | 0.7 | 2.7 |
| San Francisco | 3.3 | 2.5 | (0.5) | 2.2 |
| Philadelphia | 2.9 | 2.6 | 1.3 | 1.8 |
| Kansas City | 2.8 | 2.5 | 0.2 | 2.2 |
| Columbus | 2.5 | 3.3 | 1.3 | 2.6 |
| Detroit | 2.2 | 2.7 | 0.7 | 0.9 |
| New Jersey | 1.9 | 2.3 | 1.1 | 2.7 |
| Boston | 1.5 | 2.1 | 0.0 | 2.7 |
The major metros with the smallest year-over-year apartment rent growth as determined by Yardi Matrix are listed in the next table, below, along with the other data as in the table above.
| City | YoY rent | YoY rent last month |
YoY jobs (6 mo moving avg) |
Completions as % of stock |
| Denver | (4.3) | (3.8) | 0.0 | 6.4 |
| Austin | (4.0) | (4.5) | 1.2 | 8.6 |
| Phoenix | (3.3) | (2.8) | 0.3 | 5.4 |
| Las Vegas | (2.0) | (1.4) | 0.3 | 2.6 |
| Dallas | (1.9) | (1.8) | 1.1 | 3.6 |
| Charlotte | (1.1) | (0.6) | 2.2 | 7.4 |
| San Diego | (1.1) | (1.3) | 0.7 | 2.4 |
| Atlanta | (1.0) | (0.2) | 0.5 | 3.6 |
| Orlando | (0.8) | (1.2) | 1.9 | 5.7 |
| Tampa | (0.7) | (0.1) | 1.0 | 4.6 |
The top metros for month-over month rent growth in September were New York, San Francisco, Philadelphia and Kansas City. Only Philadelphia and Kansas City were in the top 4 in last month’s report. The trailing metros this month were Tampa, Boston, Raleigh and Las Vegas. None of these was in the bottom 4 in last month’s report.
Single-family rentals rents unchanged
Yardi Matrix also reported that single-family rental build-to-rent (SFR) rents dropped $15 in September from the revised (+$1) level of the month before to $2,194 per month. SFR rents were unchanged year-over-year.
Yardi Matrix reported on the top 30 markets for built-to-rent single-family rentals, 15 of which saw rents grow year-over-year in September. The leading markets for year-over-year rent growth were Twin Cities, Kansas City, Chicago and Columbus.
The markets with the lowest year-over-year rent growth were Tampa, Austin, Denver, and Raleigh.
The national occupancy rate for single-family rentals rose 0.1 percentage point from that reported last month to 95.1 percent in August. The national occupancy rate was unchanged year-over-year.
This month, 18 of the metros saw year-over-year occupancy increases. The metros with the largest year-over-year occupancy increases were Jacksonville, Miami, Charleston and San Antonio. The metros with the greatest occupancy declines were Harrisburg, Pensacola, Kansas City and Raleigh.
The complete Yardi Matrix report provides information on some of the smaller multifamily housing markets and more information on the differences in results between lifestyle and RBN properties. It can be found here.


