

The Census Bureau released its monthly new residential construction report for October 2019. The report showed a continued surge in the number of building permits issued. Starts were also strong but completions lag for now.
Permits reach new highs
Other than for a weak June figure, the number of permits issued for buildings with 5 or more units have been strong recently. They were up by 6.1 percent from September’s revised reading to 505,000 units on a seasonally adjusted, annualized basis. This is a very high rate and has only been exceeded recently by August’s reading of 508,000 permits. Compared to the year-earlier level, permits for buildings with 5 or more units were also up, rising 27.5 percent.
In addition, 47,000 permits were issued in October for buildings with 2 to 4 units, a recent high.
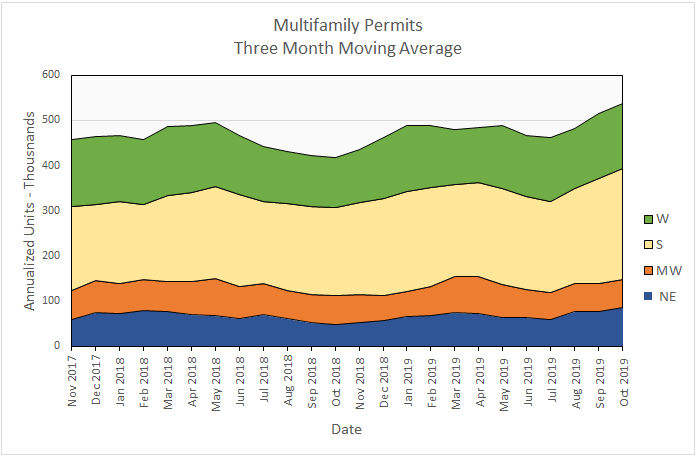
Regional data for multifamily housing is only reported for structures with two or more units. “Structures with 5 or more units” is not broken out as a separate category. Since the regional data is highly volatile and is frequently revised, it is examined here based on three-month moving averages.
Nationally, the three-month moving average for permits issued for multifamily housing in October was up 4.1 percent from September and up 28.3 percent from the level of September 2018. This is shown in the first chart, below.
On a month over month basis, the Northeast and South saw rises in permits issued of 11.5 percent and 6.0 percent respectively. Permit issuance was down in the Midwest and West, but by less than one percent in each case.
Compared to year-earlier levels, the number of units permitted rose strongly in all regions except the Midwest where they were down less than 5 percent. The regions of the country representing most construction activity, the South and the West were up 26.0 percent and 29.8 percent respectively. The reading in the West is especially interesting in that the recent rent control laws passed in California and Oregon might have been expected to dampen interest in this region. This appears to have not yet happened.
Multifamily housing construction starts up
Multifamily housing construction starts have been on a roller-coaster of late with significant rises and falls in the numbers reported month by month. In October, the level of construction starts for buildings with 5 or more units was up by 6.8 percent from the revised figure for the month earlier. The 362,000 starts reported on a seasonally-adjusted, annualized basis, is almost exactly the average of the monthly reports for the last two years.
Compared to year-earlier levels, construction starts for buildings with 5 or more units were also up, rising 10.7 percent from the October 2018 level.
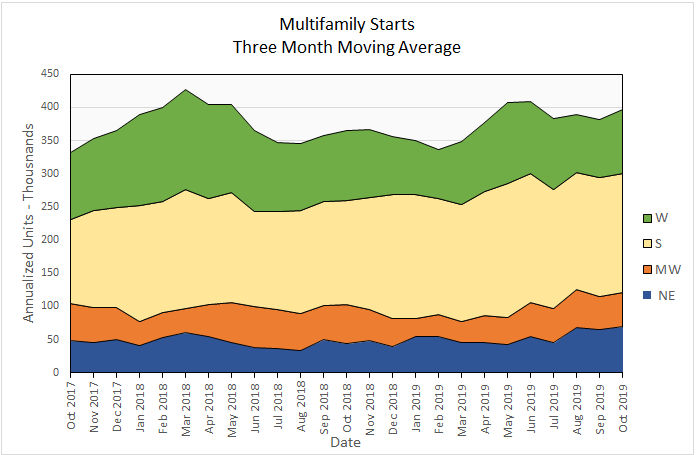
Multifamily housing construction starts (two or more units per building) were up 8.6 percent from their September levels for the country as-a-whole, based on three-month moving averages. The Midwest and the West each saw starts rise by more than 30 percent on the month while the Northeast and the South each saw starts fall by a little under 10 percent.
On a year-over-year basis, starts were up 9 percent for the country-as-a-whole. Starts surged in the Northeast by 57 percent compared to year-earlier levels. Starts were also up modestly in the South but were down slightly in the Midwest and West.
The following chart shows the starts by region for the last 25 months.
Completions bounce back
Nationally, completions of buildings with 5 or more units rose 27.3 percent in October from the month-earlier level, reaching 354,000 units on an annualized basis. This comparison was helped by the fact that the revised September level of completions was only 278,000 units on a seasonally-adjusted, annualized basis. Only June 2019 had fewer completions in the last two years. Compared to the year-earlier level, completions of building with 5 or more units in October were up 25.5 percent, although October 2018 was also a relatively week month for completions.
For the country as-a-whole, completions for multifamily housing (two or more units per building) were up slightly, rising 2 percent month-over-month, comparing three-month moving averages. Note that bad weather in late 2018 suppressed completions then and led to a surge in completions in early 2019, distorting the “natural” level of completions and making trends harder to spot. Still, completions have been running below the two-year average for the last 5 months. While this could indicate a softening in the market, it is at odds with the strength seen in permit issuance.
By region, the three-month moving averages of completions were up in the Northeast and the West but down in the Midwest and the South.
On a year-over-year basis, the three-month moving average of completions was up by 8 percent. By region, the story was again mixed with completions rising strongly in the West and the Northeast but falling modestly in the Midwest and the South.
Completions by region for the past 25 months are shown in the chart below.

All data quoted are based on seasonally adjusted results and are subject to revision.


