The Census Bureau released its monthly new residential construction report for March 2020. It presents a mixed picture for multifamily housing construction with some softening of results but from a strong base.
Permits are mixed
The number of permits issued for buildings with 5 or more units rose slightly in March to 423,000 units on a seasonally adjusted, annualized basis. This was up 5 percent from the figure for February, mostly because that figure was revised down by 13,000 units. March permits were down 4 percent from the number of permits issued in March 2019.
The onset of the COVID-19 crisis is generally taken to be the middle of March, so this is the first report in which its impact on construction activity might be apparent. The fact that permits for buildings with 5 or more units were up during the month, albeit from a relatively weak February figure, is a positive sign.
In addition, 46,000 permits were issued in March for buildings with 2 to 4 units. This was up by 1,000 from the previous month.
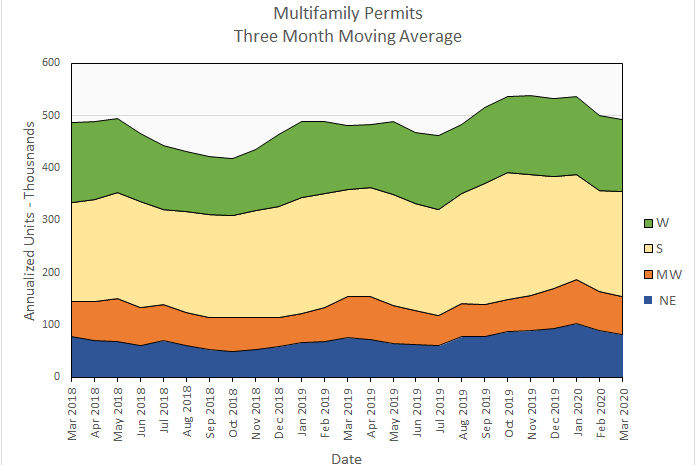
Regional data for multifamily housing is only reported for structures with two or more units. “Structures with 5 or more units” is not broken out as a separate category. Since the regional data is highly volatile and is frequently revised, it is examined here based on three-month moving averages.
Nationally, the three-month moving average for permits issued for multifamily housing in March was down 2 percent from the February level but was up 3 percent from the level of March 2019. This is shown in the first chart, below. The three-month moving average came it at 493,000 units, the first time it has been below 500,000 units since August 2019.
On a month over month basis, permit issuance was up by 5 percent in the South but was down in all other regions of the country. Permits fell 9 percent in the Northeast, 5 percent in the West and 3 percent in the Midwest.
Compared to year-earlier levels, permits were up by 13 percent in the West and 8 percent in the Northeast. Permits fell by 9 percent in the Midwest and 1 percent in the South compared to March 2019.
The following chart shows the permits by region for the last 25 months.
Multifamily housing construction starts down
The good news for housing starts in this reports is that starts in buildings with 5 or more units per building in January were adjusted up by 6,000 units to 618,000 units and that starts in February were adjusted up by 3,000 units to 511,000 units. The bad news is that the preliminary figure for starts in March came in at only 347,000 units. While this is down 32 percent from the February figure, it is only down 4 percent from the figure for March 2019, an indication of how strong multifamily housing starts have been recently.
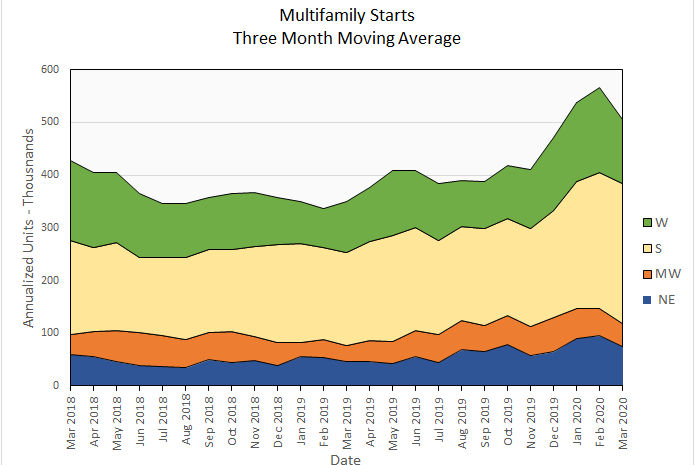
Multifamily housing construction starts (two or more units per building) in March were down 11 percent from their February levels for the country as-a-whole, based on three-month moving averages. Starts actually rose 3 percent in the South but fell by 18 to 24 percent in all other regions of the country.
On a year-over-year basis, starts were up 45 percent for the country-as-a-whole, based on 3 month moving averages. Compared to the relatively weak levels of March 2019, starts were up strongly in all regions of the country. Starts rose by a high of 65 percent in the Northeast to a low of 27 percent in the West. In absolute terms, the South increased its construction dominance with starts there representing over half of the starts for the country as-a-whole.
The following chart shows the starts by region for the last 25 months.
Completions results mixed
A surprise in last month’s report was a sharp fall in unit completions in buildings with 5 or more units. The current report shows that these completions bounced back in March, rising 26 percent from the February figure to 357,000 units on a seasonally adjusted, annualized basis. While this figure is down 4 percent from the level of March 2019, it is slightly higher than the average of completions of the prior 12 months.
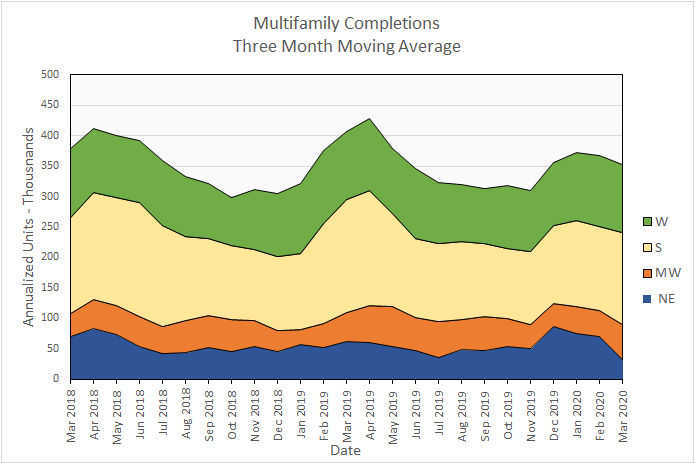
For the country as-a-whole, completions for multifamily housing (two or more units per building) were down 4 percent month-over-month, comparing three-month moving averages. This is following the trend of the previous two years where completions surged early in the year only to trail off through the summer.
By region, the three-month moving averages of completions were up 32 percent in the Midwest and 9 percent in the South. Completions fell by 4 in the West and by 53 percent in the Northeast.
On a year-over-year basis, the three-month moving average of completions in building with 2 or more units per building was down 13 percent nationally. Regional results were highly variable with completions rising by 20 percent in the Midwest and by 1 percent in the West but falling by 19 percent in the South and by 48 percent in the Northeast.
Completions by region for the past 25 months are shown in the chart below.
All data quoted are based on seasonally adjusted results and are subject to revision.


