

The Census Bureau’s report on residential construction spending for January shows a 2.7 percent increase from December’s level. Overall construction spending was up 0.9 percent for the month and was 3.8 percent higher than its level in January 2020.
Residential completions rise
The preliminary report on total private residential construction put in place in January 2021 came in at $713 billion on a seasonally adjusted, annualized basis. This figure, which includes spending on both new construction and on renovations, was up 2.5 percent for the month and was up 21.0 percent from the level of January 2020.
The value of new construction of multifamily residential buildings put in place in January came in at $92.7 billion on a seasonally adjusted, annualized basis. This was up 0.7 percent from the revised level for December. However, the December figure was revised up by 1.0 percent from the preliminary figure reported last month so the January rise is stronger than the percentage figure would suggest. The value of multifamily housing construction put in place in January was 16.9 percent higher than the level of January 2020.
The value of new construction of single-family residential buildings put in place in January came in at $376.2 billion on a seasonally adjusted, annualized basis. This was up 3.0 percent from the revised level for December and was up 24.2 percent from the level for January 2020.
Taking the long view
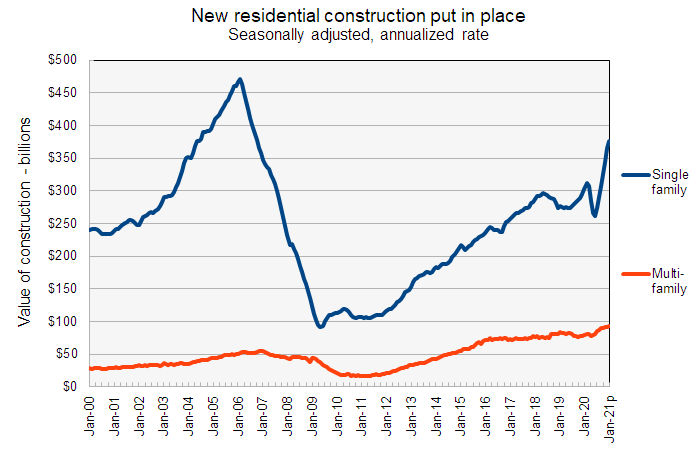
The first chart, below, shows the history of new residential construction spending, both single-family and multifamily, since January 2000. The recent data shows how the value of single-family completions surged late in 2020 after slumping when the COVID-inspired shutdowns were imposed in the spring. The value of multifamily housing completions put in place was less impacted by the pandemic, both before and after the shutdowns.
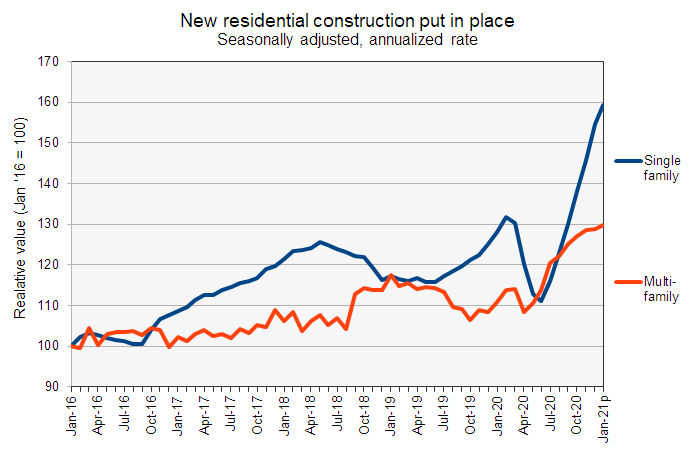
The second chart focuses on the time period since January 2016. In this chart, the value of the construction put in place for the two residential property types is normalized so that the reading for January 2016 equals 100. While the chart shows the recent surge in the value of single-family residential construction put in place, the big drop-off in the spring may indicate that the surge is the result of builders catching up with projects that were delayed earlier in the year. Multifamily construction put in place seems to have been less impacted by the pandemic so the year-end rise may be more organic.
The report from the Census Bureau also includes information on spending on other types of construction projects. The full report can be found here.


